

0 Views
Department of Economics, Vijayanagara Sri Krishnadevaraya University, Ballari – 583105, Karnataka.
Diurnal temperature range (DTR), the difference between daily maximum and minimum temperature, is an important indicator of asymmetric warming. This study analyses long-term spatial variability in DTR across Karnataka, India, using district-level temperature series derived from the TerraClimate dataset for 1958–2024. Annual DTR trends were evaluated using the non-parametric Mann–Kendall test and Sen’s slope estimator. Results indicate pronounced spatial heterogeneity across districts. Increasing DTR trends occur primarily in southern Karnataka, whereas decreasing trends dominate northern semi-arid regions. Several coastal districts exhibit weak or non-significant trends. These findings demonstrate that aggregated temperature indicators mask substantial regional variability in diurnal thermal behaviour.
KEYWORDS: Climate variability; diurnal temperature range; Karnataka; mann–kendall test; spatial analysis.
Diurnal temperature range (DTR), the difference between daily maximum (Tmax) and minimum (Tmin) temperatures, captures changes in the relative behaviour of daytime and nighttime temperatures that are not evident from mean temperature alone. DTR is influenced by cloud cover, atmospheric moisture, surface radiation, soil moisture and land-surface characteristics, making its long-term variation useful for examining regional differences in warming.
Changes in DTR have been observed across many regions, often reflecting unequal rates of change in Tmax and Tmin. Karl et al. (1993) reported faster increases in minimum than maximum temperatures across many locations, resulting in a decline in DTR. Subsequent studies have related DTR variability to precipitation, cloud cover and associated changes in surface radiation (Zhou et al., 2009). In India, Roy and Balling (2005) reported an inverse association between DTR and cloud cover, indicating the importance of cloudiness in modifying daytime and nighttime temperature differences.
Long-term temperature records for India also show marked spatial variation in the behaviour of Tmax and Tmin (Kumar et al., 1994; Kothawale and Rupa Kumar, 2005; Mall et al., 2021). Dhorde et al. (2017) identified spatial differences in temperature trends across Maharashtra and Karnataka, while Mohapatra (2002) reported changes in DTR over Bengaluru in association with urbanisation and local environmental change. At the district scale, Simpson et al. (2024) documented spatial variation in temperature and rainfall trends across Karnataka. Their analysis, however, did not specifically examine DTR. District-level evidence on long-term DTR trends across Karnataka therefore remains limited.
This gap is important because Karnataka contains markedly different climatic regions, ranging from the humid coast and Western Ghats to the semi-arid interior. State-level averages may therefore conceal differences in the relative rates of daytime and nighttime warming. Gridded climate data make it possible to examine these differences consistently across districts and over long periods, including areas where station coverage may be uneven.
The present study examines long-term DTR trends across Karnataka using district-level Tmax and Tmin series derived from TerraClimate for 1958–2024. The Mann–Kendall test and Sen’s slope estimator are used to assess the direction, statistical significance and magnitude of trends. The analysis focuses on whether the relatively stable statewide DTR pattern masks contrasting trends among districts and on the spatial distribution of these changes across Karnataka.
Karnataka is located in southern India between approximately 11°–18° N latitude and 74°–78° E longitude. The state encompasses diverse climatic and physiographic regions, including the humid coastal belt along the Arabian Sea, the elevated Western Ghats mountain range, and the semi-arid interior plateau. These regions differ substantially in rainfall, temperature regimes, elevation, and land-surface characteristics. Annual rainfall exceeds 3,000 mm in parts of the Western Ghats but falls below 600 mm in northern interior districts. Temperature conditions also vary considerably across these zones due to differences in altitude, continentality, and proximity to maritime influences. This pronounced environmental heterogeneity makes Karnataka an appropriate region for examining spatial patterns and long-term variability in diurnal temperature range.
Monthly maximum temperature (Tmax) and minimum temperature (Tmin) data were obtained from the TerraClimate dataset, a high-resolution global climate dataset providing monthly climate and water balance variables at approximately 1/24° spatial resolution (~4 km). TerraClimate integrates high-resolution climatology with global reanalysis data and station observations to generate spatially consistent climate fields (Abatzoglou et al., 2018). The dataset covers the period from 1958 onward and is widely used for long-term climate analyses.
District-level temperature series were derived by overlaying Karnataka district boundary polygons on the TerraClimate grid. Monthly Tmax and Tmin values were calculated as spatial averages of all grid cells intersecting each district boundary. Diurnal temperature range (DTR) was then computed as the difference between Tmax and Tmin for each district and month. The monthly district-level series spanning 1958–2024 were subsequently aggregated to annual averages to construct long-term time series for trend analysis.
Long-term trends in annual DTR were evaluated using the non-parametric Mann–Kendall (MK) test. The MK test is widely used in climatological studies because it does not require the data to follow a specific distribution and is robust to outliers. The method assesses whether a monotonic upward or downward trend exists in a time series.
For a time series x1,x2,…,xn, the MK test statistic Sis calculated as:
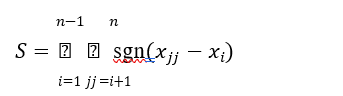
where the sign function is defined as:
1, if 𝑥𝑗𝑗 − 𝑥𝑖 > 0
sgn(𝑥𝑗𝑗 − 𝑥𝑖 ) = � 0, if 𝑥𝑗𝑗 − 𝑥𝑖 = 0
−1, if 𝑥𝑗𝑗 − 𝑥𝑖 < 0
Under the null hypothesis of no trend, the variance of Sis given by:
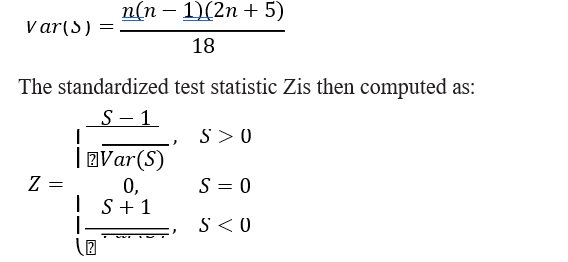
A positive value of Zindicates an increasing trend, whereas a negative value indicates a decreasing trend. Statistical significance was assessed at the 5 per cent significance level (p<0.05).
The magnitude of the monotonic trend in DTR was estimated using Sen’s slope estimator. This method calculates the median slope of all possible pairs of observations in the time series and provides a robust estimate of the rate of change over time.
For all pairs of observations (xi,xj )where j>i, the slope is calculated as:
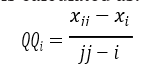
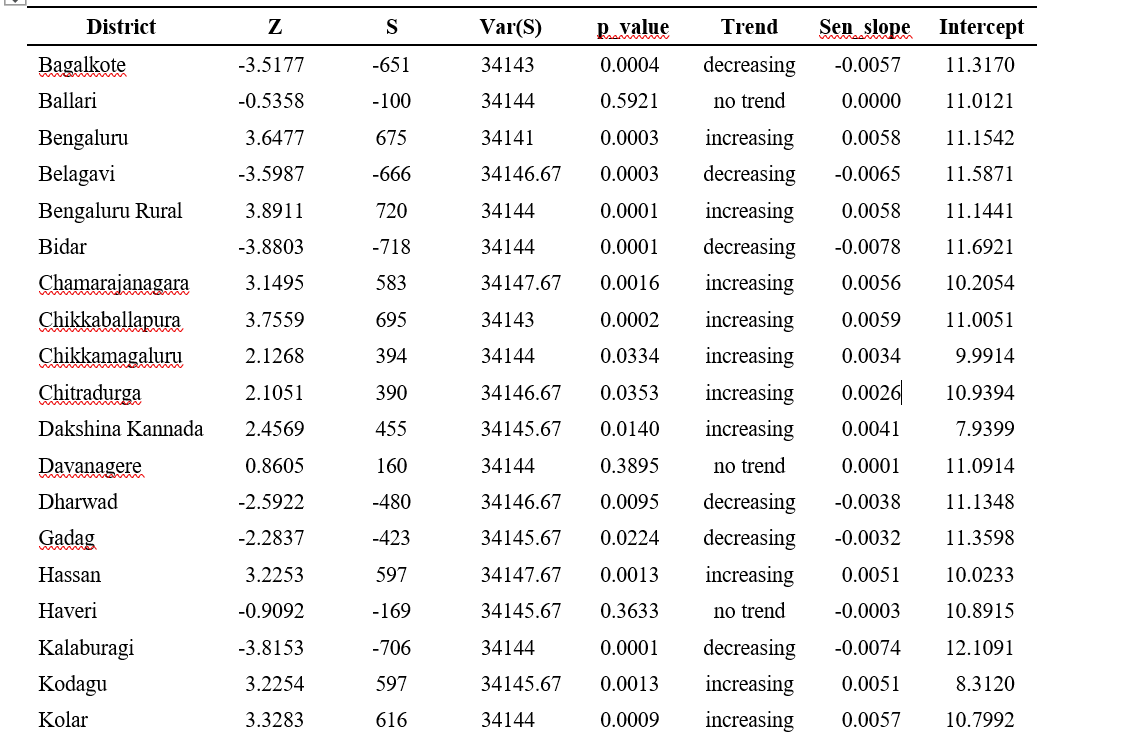
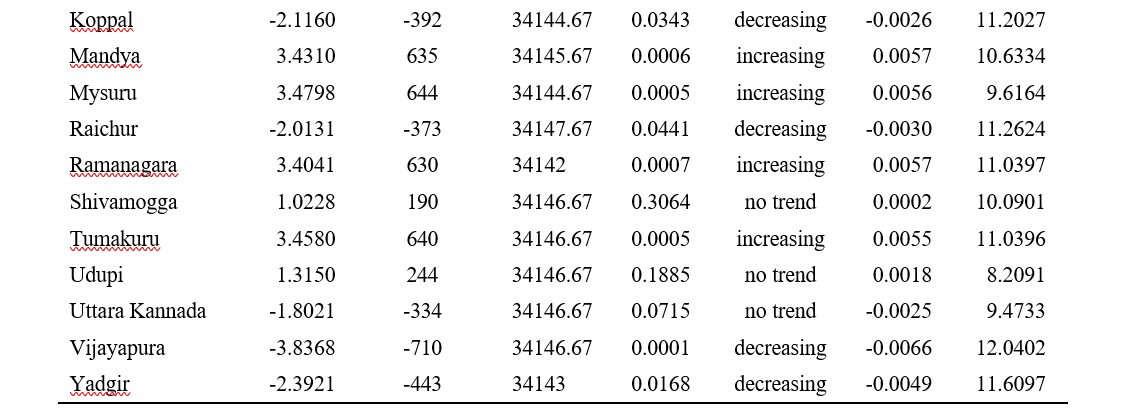
Table 1. District-wise Mann–Kendall (MK) test statistics and Sen’s slope estimates for diurnal temperature range (DTR) across Karnataka for the period 1958–2024. Positive (negative) Z values and Sen’s slopes indicate increasing (decreasing) DTR trends. Statistically significant trends are identified at the 5% significance level.
The Sen’s slope estimate is the median of all calculated slopes: Q=”median”(Qi)
Positive values of Qindicate increasing trends, while negative values indicate decreasing trends. The slope values represent the annual rate of change in diurnal temperature range for each district.
All data processing and statistical analyses were conducted using Python within the Spyder integrated development environment. Spatial aggregation of TerraClimate data to district boundaries was performed using geospatial libraries, and statistical analyses were implemented using standard scientific computing packages. Trend statistics and slope estimates were computed for each district-level DTR time series covering the period 1958–2024.
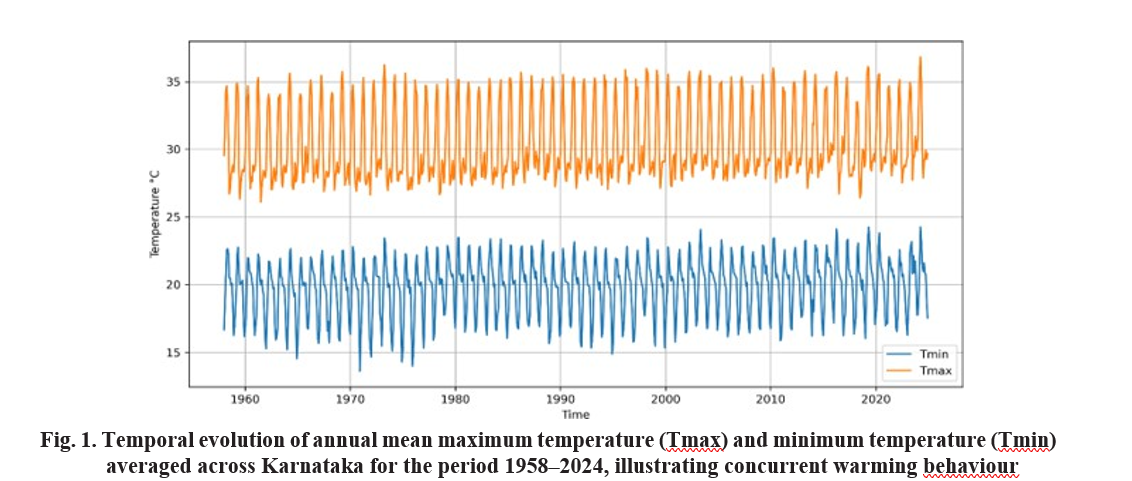
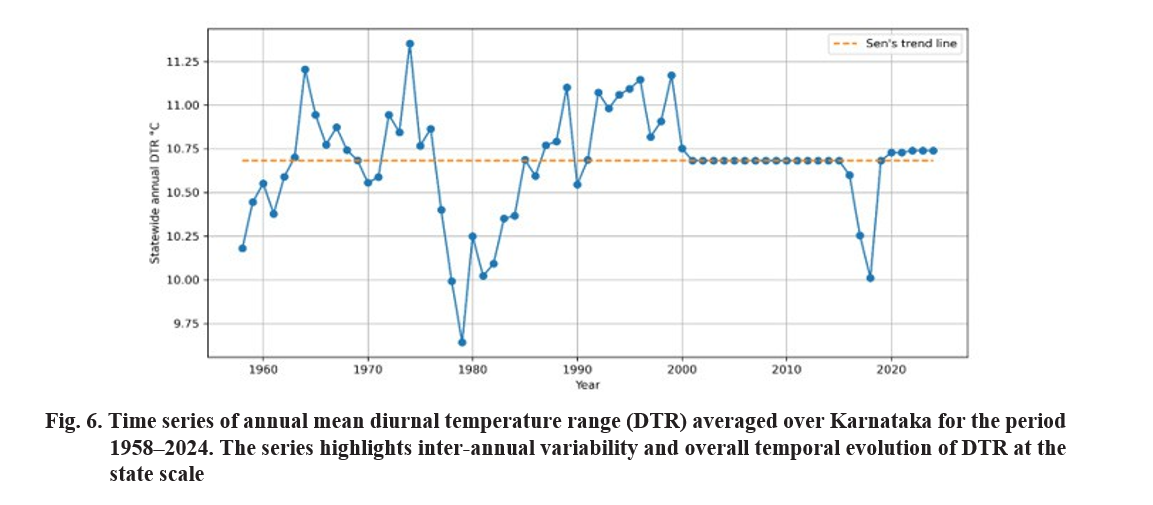
The annual mean diurnal temperature range (DTR) averaged across Karnataka exhibits moderate inter-annual variability over the period 1958–2024 (Fig. 6). Statewide mean DTR values generally fluctuate between approximately 10 and 11.3 °C, indicating relatively stable long-term thermal variability at the aggregated scale. Although both maximum temperature (Tmax) and minimum temperature (Tmin) show gradual increases over time (Fig. 1), their broadly concurrent behaviour results in limited long-term change in the state-averaged DTR series.
Temporal fluctuations are nevertheless evident across different decades. Higher DTR values occur during parts of the 1960s, followed by relatively lower averages during the 1970s. Subsequent decades show gradual recovery and stabilization, with moderate year-to-year variability persisting through the most recent period. These results suggest that while long-term warming has occurred across Karnataka, the relative balance between daytime and nighttime temperatures has remained broadly stable when averaged across the entire state. However, aggregated averages may conceal important spatial differences in temperature behaviour across districts.
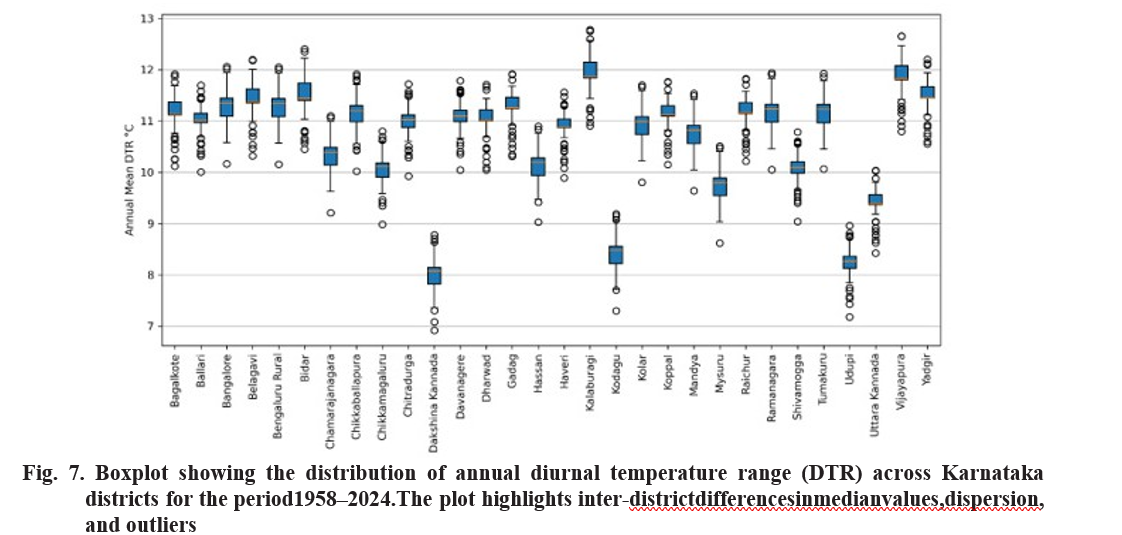
Substantial spatial variability in DTR is observed across Karnataka districts (Fig. 7). Coastal districts such as Dakshina Kannada, Udupi, and Uttara Kannada exhibit relatively low median DTR values, typically around 8 °C, with comparatively narrow distributions. These patterns are consistent with the moderating influence of maritime air masses, higher humidity, and persistent cloud cover, which tend to reduce daytime heating and limit diurnal thermal contrasts.
In contrast, interior semi-arid districts including Kalaburagi, Vijayapura, Bagalkote, Gadag, and Ballari display higher median DTR values, often exceeding 11–12 °C. These districts also exhibit wider interquartile ranges, reflecting greater inter-annual variability in diurnal thermal conditions. The larger DTR values observed in these regions are consistent with lower humidity, reduced cloud cover, and stronger daytime heating typical of continental semi-arid climates.
Districts located within transitional or topographically complex regions, including Belagavi, Shivamogga, and Chikkamagaluru, show broader distributions and occasional outliers in DTR values. These patterns suggest greater sensitivity to inter-annual climatic variability in areas influenced by both coastal and interior climatic regimes.
The spatial distribution of long-term mean Tmax and Tmin across districts is shown in Fig. 4. The relationship between annual mean Tmax and Tmin across Karnataka demonstrates a strong positive association (Fig. 5), indicating that warming trends generally involve concurrent increases in both daytime and nighttime temperatures. However, the dispersion of Tmin values varies across the Tmax range. Lower Tmax values, typically associated with higher-elevation or coastal districts, correspond to relatively narrow Tmin ranges. In contrast, intermediate Tmax values display a wider spread in Tmin, reflecting greater variability in nighttime temperatures across districts.
At higher Tmax levels, Tmin tends to increase more rapidly, suggesting stronger nighttime warming in warmer interior districts. Such behaviour may be associated with regional differences in atmospheric moisture, land-surface conditions, or radiative processes
that influence nighttime heat retention. These variations in the relative behaviour of Tmax and Tmin contribute to spatial differences in DTR trends across the state.
Decadal averages of Tmax indicate a consistent increase across most districts from the earlier period (1960–1980) to the more recent period (2000–2024) (Fig. 2). Northern and north-eastern districts maintain the highest daytime temperatures throughout the study period, while districts in the Western Ghats and southern regions remain comparatively cooler due to elevation and maritime influences. Nevertheless, the overall pattern suggests widespread warming across Karnataka in recent decades.
Minimum temperature trends show a broadly similar pattern of long-term increase (Fig. 3). Coastal and Western Ghats districts consistently exhibit higher Tmin values relative to interior regions, reflecting the moderating effects of humidity and cloud cover. However, interior districts display notable increases in Tmin over time, indicating progressive nighttime warming across much of the state.
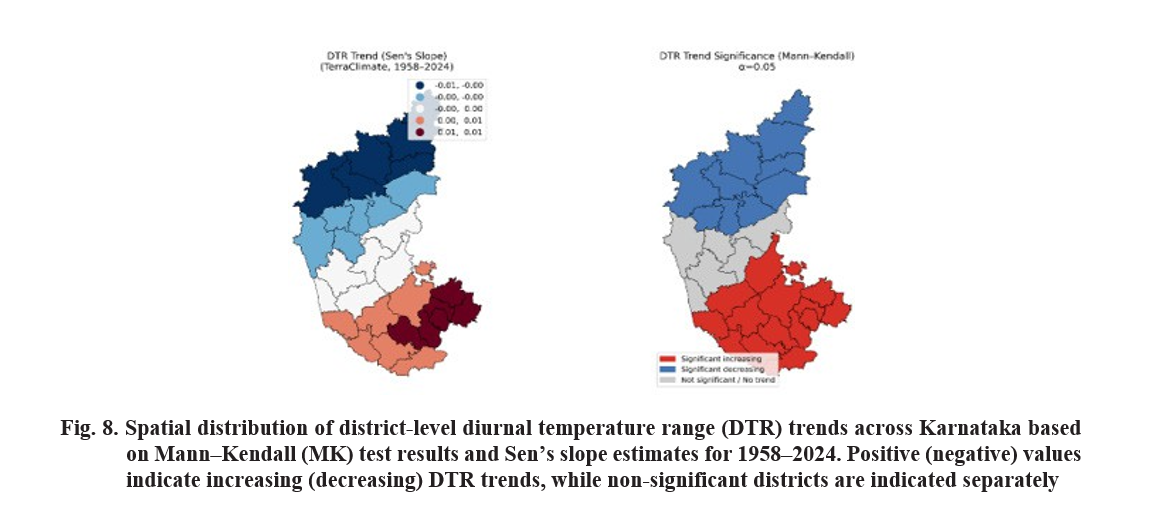
Results from the Mann–Kendall trend analysis and Sen’s slope estimation reveal pronounced spatial heterogeneity in long-term DTR trends across Karnataka (Table 1; Fig. 8). Of the 30 districts analysed, 14 exhibit statistically significant increasing trends, 10 display statistically significant decreasing trends, and 6 show no statistically significant monotonic trend.
Increasing DTR trends are primarily concentrated in southern and south-eastern districts, including Bengaluru, Bengaluru Rural, Chikkaballapura, Mandya, Mysuru, Tumakuru, Kolar, Hassan, Kodagu, Ramanagara, Dakshina Kannada, and Chamarajanagara. Sen’s slope estimates for these districts range from approximately 0.0026 to 0.0059 °C yr⁻¹, indicating persistent long-term increases in diurnal temperature range.
In contrast, decreasing DTR trends dominate northern and north-eastern semi-arid districts such as Bidar, Kalaburagi, Vijayapura, Bagalkote, Belagavi, and Yadgir. These districts exhibit Sen’s slope values ranging from approximately −0.0026 to −0.0078 °C yr⁻¹, indicating gradual compression of diurnal temperature range over time.
Districts without statistically significant trends show near-zero Sen’s slope estimates, suggesting relatively stable long-term DTR conditions or offsetting inter-annual fluctuations. Baseline DTR levels also vary substantially across districts, with lower intercept values observed in coastal and Western Ghats regions and higher values in interior semi-arid districts.
The contrasting spatial patterns observed in this study highlight the importance of regional climatic and environmental factors in shaping diurnal thermal
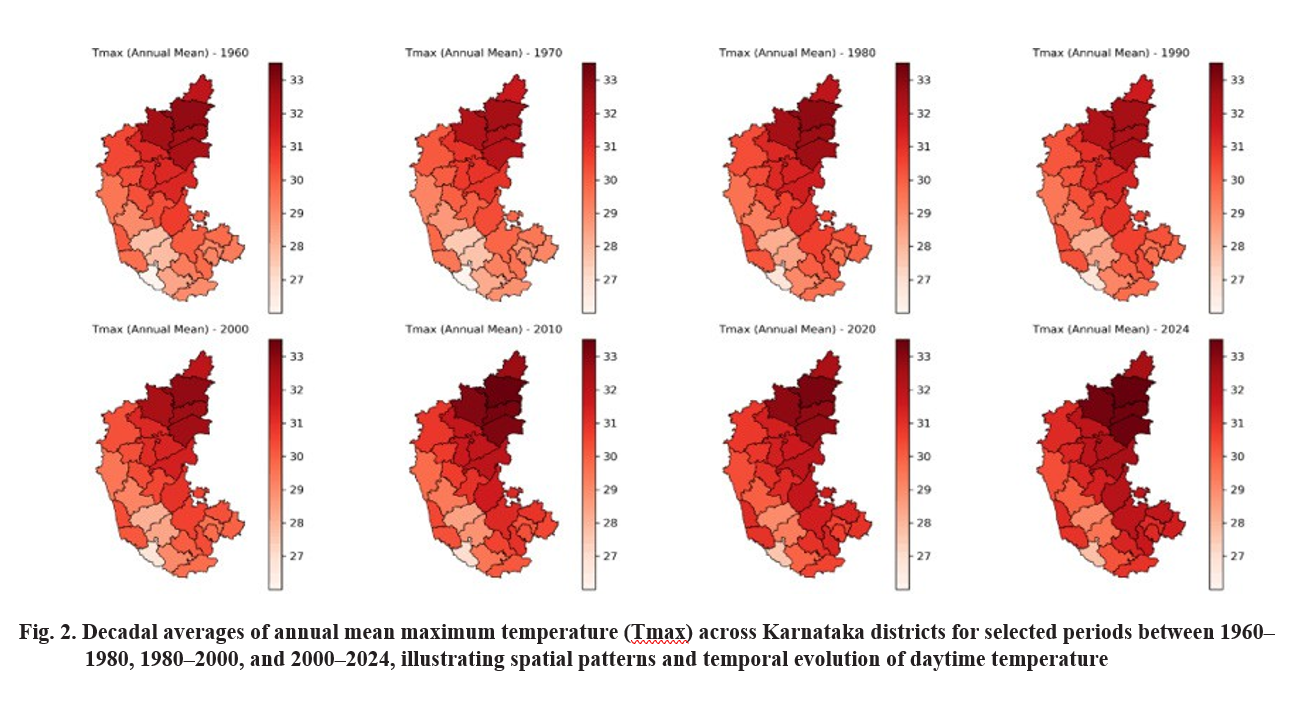
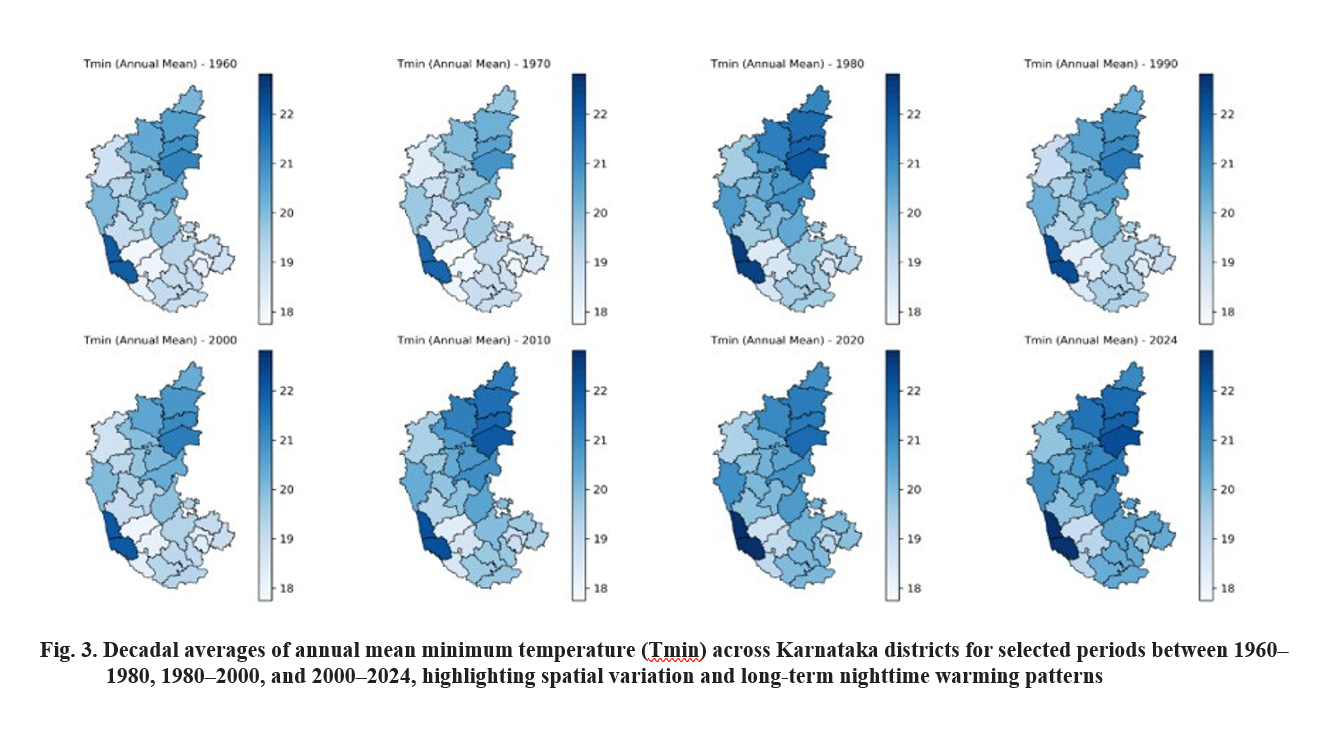
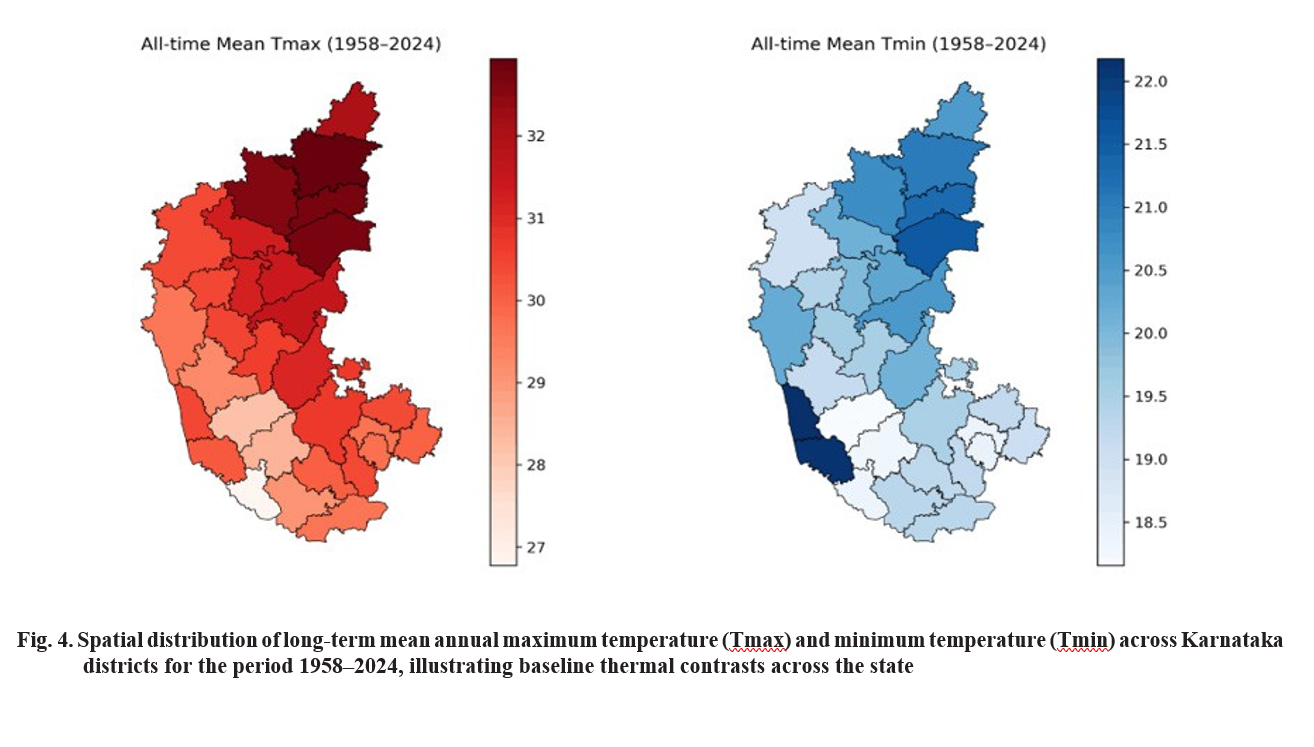
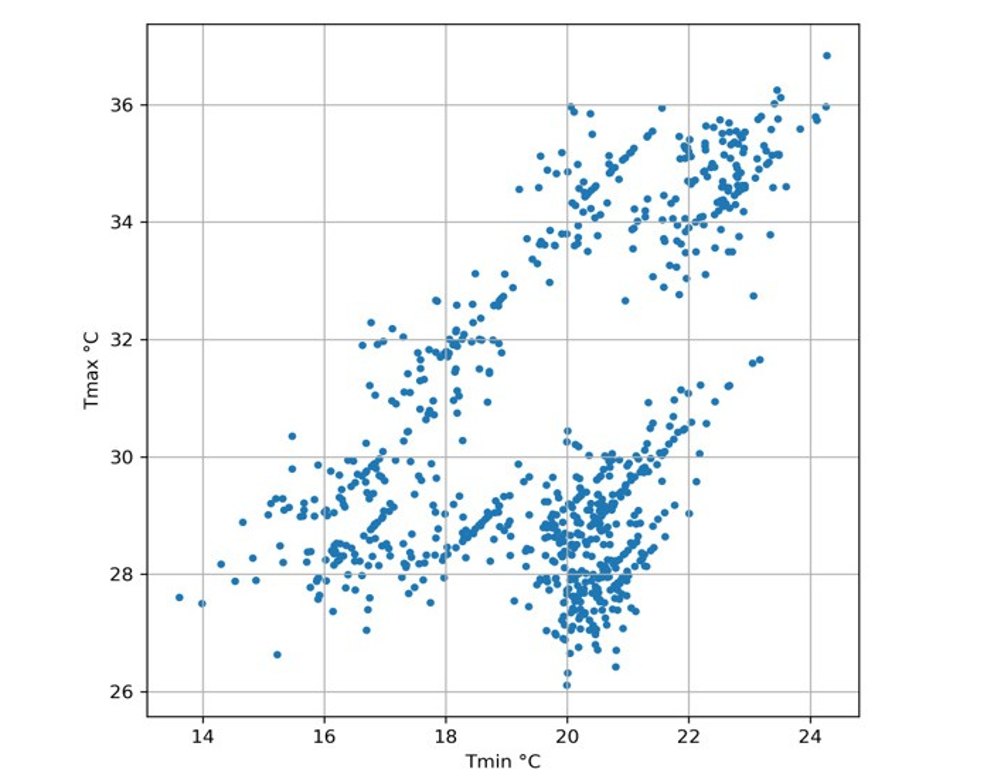
Fig. 5. Relationship between annual mean maximum temperature (Tmax) and minimum temperature (Tmin) across Karnataka for 1958–2024. Colour-coded points illustrate different temperature ranges and associated thermal conditions
behaviour. Increasing DTR trends in southern districts suggest that daytime warming has exceeded nighttime warming in these regions. Such patterns may be associated with reduced cloud cover, land-surface changes, or enhanced solar radiation that increases daytime heating.
Conversely, decreasing DTR trends in northern semi-arid districts indicate relatively stronger nighttime warming compared with daytime temperatures. This behaviour may reflect increased atmospheric moisture, irrigation expansion, or other land-surface processes that limit nocturnal cooling. Similar mechanisms have been proposed in earlier studies examining regional variations in diurnal temperature trends.
Coastal and Western Ghats districts generally display weaker or non-monotonic trends. The relatively stable DTR behaviour in these regions likely reflects the moderating influence of maritime climate, higher humidity, persistent cloud cover, and complex topography.
The spatial contrast in DTR trends across Karnataka may reflect differences in regional climate regimes and land–atmosphere interactions. Northern districts of the state lie within semi-arid interior zones that experience stronger continental influences and greater sensitivity to changes in surface moisture conditions. Expansion of irrigation, increasing atmospheric humidity, and enhanced cloud cover can reduce nocturnal cooling and elevate minimum temperatures, thereby contributing to declining DTR. In contrast, southern districts influenced
by higher elevation and relatively lower moisture variability may experience stronger daytime heating relative to nighttime warming, resulting in increasing DTR. Coastal and Western Ghats districts remain strongly influenced by maritime air masses, persistent cloud cover, and orographic effects associated with the southwest monsoon, which moderate both daytime heating and nighttime cooling. These regional climatic controls likely contribute to the heterogeneous spatial patterns of DTR trends observed across the state.
Overall, these findings demonstrate that statewide averages obscure significant spatial contrasts in the evolution of diurnal thermal regimes. District-level analysis reveals divergent warming pathways within the state, emphasizing the importance of spatially resolved temperature indicators for understanding regional climate variability.
This study examined long-term spatial patterns in diurnal temperature range (DTR) across Karnataka using district-level temperature series derived from the TerraClimate dataset for the period 1958–2024. Trend analysis using the Mann–Kendall test and Sen’s slope estimator reveals pronounced spatial heterogeneity in DTR behaviour across the state. While statewide averages indicate relatively stable long-term DTR conditions, district-level analysis shows contrasting regional trends.
Increasing DTR trends are primarily observed in southern and south-eastern districts, suggesting that daytime warming has exceeded nighttime warming in these regions. In contrast, decreasing DTR trends dominate northern semi-arid districts, reflecting relatively stronger increases in minimum temperatures and a gradual compression of the diurnal temperature range. Coastal and Western Ghats districts generally exhibit weak or statistically insignificant trends, likely due to the moderating influence of maritime conditions and higher humidity.
These findings demonstrate that aggregated temperature indicators can obscure important regional differences in thermal behaviour. Spatially resolved assessments of diurnal temperature range provide valuable insight into regional climate variability and may help inform environmental monitoring and climate adaptation strategies in climatically heterogeneous regions.
The author acknowledges financial support from the Indian Council of Social Science Research (ICSSR) through Major Research Project G133.
Abatzoglou, J.T., Dobrowski, S.Z., Parks, S.A and Hegewisch, K.C. 2018. Terra Climate, a high-resolution global dataset of monthly climate and climatic water balance from 1958–2015. Scientific Data. 5:170191.
Dhorde, A.G., Korade, M.S and Dhorde, A.A. 2017. Spatial distribution of temperature trends and extremes over Maharashtra and Karnataka states of India. Theoretical and Applied Climatology. 130:191–204.
Karl, T.R., Jones, P.D., Knight, R.W., Kukla, G., Plummer, N., Razuvayev, V., Gallo, K.P., Lindseay, J., Charlson, R.J and Peterson, T.C. 1993. A new perspective on recent global warming: asymmetric trends of daily maximum and minimum temperature. Bulletin of the American Meteorological Society. 74: 1007–1023.
Kothawale, D.R and Rupa Kumar, K. 2005. On the recent changes in surface temperature trends over India. Geophysical Research Letters. 32: L18714.
Kumar, K.R., Krishna Kumar, K and Pant, G.B. 1994. Diurnal asymmetry of surface temperature trends over India. Geophysical Research Letters. 21: 677–680.
Mall, R.K., Chaturvedi, M., Singh, N., Bhatla, R., Singh, R.S., Gupta, A and Niyogi, D. 2021. Evidence of asymmetric change in diurnal temperature range in recent decades over different agro-climatic zones of India. International Journal of Climatology. 41: 2597–2610.
Mohapatra, M. 2002. Recent trends in climate of Bangalore. Mausam. 53: 425–438.
Roy, S.S and Balling, R.C. 2005. Analysis of trends in maximum and minimum temperature, diurnal temperature range, and cloud cover over India. Geophysical Research Letters. 32: L12702.
Simpson, R., Abhilash, K.P., Kavya, R and Hiremath, S. 2024. Examining two decades of climate variability in Karnataka: insights from temperature and rainfall trends. International Journal of Environment and Climate Change. 14: 97–109.
Zhou, L., Dai, A., Dai, Y., Vose, R.S., Zou, C.Z., Tian, Y. and Chen, H. 2009. Spatial dependence of diurnal temperature range trends on precipitation from 1950 to 2004. Climate Dynamics. 32: 429–440.