
0 Views
N.SRUTHI, D.BALAGURAVAIAH, V. MUNA SWAMY, A.V.NAGAVANI
Department of Soil Science and Agricultural Chemistry, S. V. Agricultural College, ANGRAU, Tirupati-517 502, Chittoor (Dist.,), Andhra Pradesh
A field experiment was conducted during kharif season 2017 on sandy loam soils of Agriculture College Farm, Mahanandi, Acharya N.G. Ranga Agricultural University, Andhra Pradesh, to evaluate different real time and site specific nitrogen management options and performance of maize crop in terms of yield and nitrogen use effi-ciency. The experiment was conducted in randomized block design with eight treatments replicated thrice. The treatments include recommended fertilizer dose (T1), soil test based fertilizer application (T2), LCC based approach i.e. apply N25 if LCC value < 5 (T3), SPAD chlorophyll meter based approach i.e. apply N25 if SPAD value < 50
(T4), Green Seeker directed N application i.e. based on NDVI (T5), Farmer Fertilizer Practice (T6), STCR based
targeted yield approach (T ) and Absolute Control (T ). The highest grain yield of maize ( 8072 kg ha-1) was
7 8
recorded in T which received 215 kg N ha-1 in five splits but was found on par with T 3 & T 4 ( 190 kg N ha-1 in 5
5
splits), T 6 (320 kg N ha-1 in three splits) and T 7 (300 kg N ha-1). Yield attributes viz., cob length (23.6 cm), cob
weight (228.6 gm) , kernels per row (38.2) , grain rows per cob (16.8), test weight (33.6 gm ) were also higher in Green Seeker based recommendation. The B:C ratio was higher in Green Seeker based treatment (3.32) followed by LCC and SPAD based approaches (3.05 & 2.92 respectively).
Leaf Colour Chart (LCC), SPAD Meter, green seeker, soil test Crop Response (STCR), NDVI (Normalized Difference Vegetation Index), nitrogen use efficiency, Maize
Maize (Zea mays L.) globally known as
queen of cereals is having the highest yield potential. In
India, it contributes nearly 9 per cent to national food
basket. In Andhra Pradesh, maize is grown in an area of
2.45 lakh hectares with a production of 16.53 lakh tons
and productivity of 6604 kg ha-1 (2016-2017) contributing 8 per cent of total country’s production. Maize needs ample quantity of N during early growth and grain filling stages and the deficiency of N in most of the cases is the most limiting factor for achieving higher production. Application of higher level of N-fertilizer is very common among Indian farmers.
However, over application of N in cereal crops, leads to further lowering of N fertilizer use efficiency.
The need for precise and responsive management of N fertilizer in maize is compelling for both economic and environmental reasons. Effective management of fertilizers, particularly N, remains a major challenge to researchers and producers (Shivakumar et al., 2017). The time of N application plays an im-portant role in achieving higher corn yield (Mariga et al., 2000). To answer the questions of when and how much fertilizer nutrient need to be applied with ease, a reliable monitoring technique to evaluate the nutrient dynamics, availability, potential of
supplying capacity of different resources viz., soil, bio-logical sources, fertilizers vis-a-vis crop requirement is very much essential.
The technique needs to be quick, effective, and should allow on-the-spot decision making (Patil, 2009).Tools such as leaf color chart (LCC), chlorophyll meter (SPAD) (Singh et al., 2011) and optical sensor – Green Seeker are presently available for site-specific and need-based N management in cereals.
Most farmers use leaf colour as a visual and subjective indicator of the need for N fertilizer. Leaf color chart has been used successfully to guide fertilizer N application in rice, wheat and maize (Bijay-singh et al., 2002). SPAD meter is a simple, quick and non destructive tool for measuring relative content of chlorophyll in leaf that is directly proportional to leaf N content . It effectively measures the relative greenness or chlorophyll content of leaves as the leaf chlorophyll content is closely related to leaf N concentration (Balasubramanian et al., 1999). ‘GreenSeeker ’ is an active optical crop canopy device with a red (650±10 nm) and a NIR (770±15 nm) sensors. This works on visible and near-infrared (NIR) spectral response from plant canopy to detect N stress. Considering usefulness of LCC, SPAD and Green Seeker tools for N management in maize, the experiment was planned with an objective to find out best decision support system to enhance growth and yield of maize and economic returns with optimum fertilizer application rate.
A field experiment was conducted during the kharif 2017 at Agricultural College farm, Mahanandi campus of Acharya N.G. Ranga Agricultural University which is geographically situated at 15°51 N latitude and 78°61 E longitude and at an altitude of 233.48 meters above mean sea level, that falls under Scarce Rainfall Agro- Climatic Zone of Andhra Pradesh .The soil was sandy loam, slightly alkaline in reaction with a pH of 7.9 , EC of 0.24 dSm-1, low in organic carbon (0.4%), low in
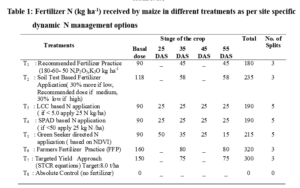
available nitrogen (100 kg N ha-1 ), low in available phosphorus (10.8 kg P2O5 ha-1) and high in available potassium (553 kg K2O ha-1). The maize hybrid kaveri 50 was used in the investigation which has resistance to stem borer and downy mildew. The experiment was conducted in a randomized block design with eight treatments and replicated thrice. The treatments include recommended fertilizer dose (T1), soil test based fertilizer application (T2), LCC based approach i.e., apply N25 if LCC value < 5(T3), SPAD chlorophyll meter based approach i.e., apply N25 if SPAD value < 50 (T4) and Green Seeker based approach i.e., based on NDVI (T5), Farmer Fertilizer Practice (T6), STCR based targeted yield approach (T7) and Absolute Control (T8).
Nitrogen fertilizer in T1 as per recommended dose (180 kg N ha-1 was applied in three split doses). In T2 , (30 % higher N over RDF i.e., 234 kg ha -1 ) in three split doses was applied as the soil available N status was low . In T3 to T5 treatments, N application was done based on the LCC, SPAD and Green Seeker observations recorded from time to time . The N, P & K fertilizer dose as per fertilizer adjustment equation was worked out and applied in T7. The quantity of fertilizer in T7 was calculated by using the following targeted yield equations for maize developed to suit to the soils of the region for a target yield of 8 t ha-1 .
FN = 4.19 T-0.39 SN
FP2O5= 1.50T-1.55 SP
FK2O = 1.49 T-0.16 SK
Where,
T = Targeted yield (q ha-1) i.e. 80 q ha-1
FN = Nitrogen supplied through fertilizer (kg ha-1)
FP2O5 = Phosphorus supplied through fertilizer (kg ha-1)
FK2O = Potassium supplied through fertilizer (kg ha-1)
SN, SP and SK are Initial available N, P2O5 and K2O, kg ha-1, respectively.
Full dose of P2O5 in the form of Single Super Phosphate (SSP), half dose of K2O through Muriate of Potash (MOP) and half dose of the nitrogen through urea were applied as basal application. The remaining half dose of K2O was applied at knee high stage, where as remaining half dose of nitrogen was top dressed in two equal splits at peak vegetative stage (knee-high stage) and tasseling stage in the treatments T1,T2,T6 and T7. Where as in T3, T4 and T5, the remaining half dose of nitrogen was applied as per demand from time to time according to LCC/ SPAD /Green Seeker readings.
After the basal N application in LCC based treatment, the subsequent N applications were done by matching the colour of youngest fully expanded top leaf of ten randomly selected maize plants from each plot at 10 days interval starting from 25 days after sowing of maize. If the mean greenness value of the ten observations is less than LCC shade 5, a quantity of 25 kg of nitrogen was top dressed, otherwise not. Matching of the leaf was discontinued and no further N was applied after initiation of silking. For Soil and Plant Analysis Development (SPAD) threshold based nutrient application, N was applied based on SPAD readings. Wherever SPAD reading was below the threshold Value of 50, a quantity of 25N kg ha-1 in the form of urea was applied. Green seeker is an optical instrument which is used to measure the amount of reflectance in the form of NDVI .
NDVI values were recorded from 25 DAS of maize, and N fertilizer dosage was calculated based on reference NDVI and nitrogen was applied as and when needed up to 55 days.
All the successive growth observations were recorded periodically during the crop growing period on the selected plants. The same plants were harvested separately for generating the data on post-harvest yield components. Data collected included cob length, number of grains cob-1, test weight and grain yield cob-1, no. of kernels per row,
no. of rows of kernels at final harvest of the crop. Grain and stover yield from net plot area was converted into per hectare basis. Economic returns were worked out based on the prevailing market prices and benefit cost ratio was computed.
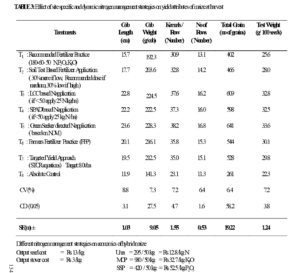
Yield attributes of maize are presented in Table 2. Cob length of maize was significantly influenced by N management strategies and varied with number of spilt applications .Cob length ranged from 11.9 cm in control T8 to 23.6 cm in Green Seeker directed application (T5) ,which received 215 N kg ha-1 in 5 splits followed by T3 (22.8 cm) and T4 (22.2 cm ).
Cob weight of maize ranged from 141.3 g/cob in T8 to 228.3 g/cob in T5 which is on par with T3 and T4 (224.5 and 222.5 g/cob respectively ). However, cob weight was less in RDF(192.5 g/cob) when compared to the other treatments which received 180 kg N ha-1. This was in agreement with the findings of Sarnaik (2010) , Akansha Raj et al.,(2018).
Number of kernels per row of maize cob ranged from 23.1 (T8) to 38.2 (T5). Highest number of kernels were observed in treatment with more no of split N applications (5 splits) coupled with relatively higher N application (215 kg ha-1 ) . It was on par with T3 and T4 (37.6 & 37.3) which received 190 kg N ha-1 in 5 splits.
Number of rows per cob also increased with N application coupled with more number of split application. It was highest in T5 with 16.8 rows while the lowest was in T8 (absolute control) with 11.3 rows. More number of rows were also recorded in T3 and T4 with 16.2 and 16.0 per cob.
Number of grains per cob ranged from 261 in control (T8) as control plot did not receive any N . Treatment ( T5 ) with 641 grains was on par with that of T3 and T4 (609 & 598 grains) which received 190 kg N ha-1.However, RDF recorded with less number of grains per cob that received only 180 kg N ha-1 when compared to other treatments. As nitrogen is associated with synthesis of more food material, more number of grains could be attributed to adequate supply of nitrogen at appropriate crop growth stages thus resulting in higher uptake and recovery of applied nutrient. This was in agreement with the findings of Sarnaik (2010), Akansha Raj et al. ,(2018).
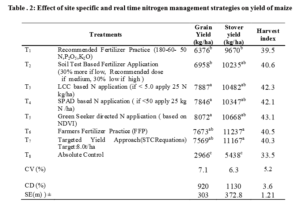
Grain yield (Table 3) was significantly influenced by dynamic N management practices where in, rate of N application and number of split applications varied (180 to 320 kg ha-1 in 3 to 5 splits) as per treatmental demand from time to time. The grain yield ranged from 2966 kg ha-1 in T8 (absolute control ) which did not receive any nitrogen to 8076 kg ha-1 in T5 (Green Seeker based NDVI ) which received 215 kg N ha-1 in 5 splits. The grain yield recorded in other treatments which received N @ 190 to 320 kg ha-1 by various treatments( T3 through T7) were found on par with each other. The treatments which received 180 kg N ha-1 (T1) and 235 kg N ha-1 (T2) recorded significantly low yields as compared to treatments T3 to T7 .
The treatment T6 which received highest N (320 kg ha-1) in 3 splits also stood on par with other treatment those received 190-300 kg N ha-1 in 3 split applications. It indicates that N fertilizer application ranging from 190 to
215 kg ha-1 based on dynamic N management strategies viz. ,Green Seeker directed NDVI approach, SPAD
based approach (apply N25 if SPAD value is <50 ) or LCC based approach (apply N25 if LCC value is < shade 5) can successfully be considered for achieving higher yield in maize. The significant higher grain yield in these approaches might be probably due to more efficient use of N enabled through more splits in small doses ( 25 kg ha -1 ) . Other important observation is that, targeted grain yield of 8 tonnes could not be achieved in T7 where N, P & K were applied based on fertilizer adjustment equations in which N fertilizer was applied in 3 split doses only though
total applied N stood at 300 kg ha-1 . The N applied must have lost through leaching as the soils were sandy loam in texture. Biradar et al. (2012) observed that applying the right dose of N, coupled with the right time of application using real time N management was beneficial in increasing the yield and profitability of maize-wheat system among farmers. The results clearly brought out the fact that N fertilizer in more number of split applications ( 5) played a crucial role in achieving the higher yield than the higher quantity of N applied ( > 215 kg ha -1 ) on a light textured sandy loam soils.
It is evident from the data (Table: 3) that stover yield differed significantly due to different N management practices .Stover yield at harvest in different treatments ranged from 5438 kg ha-1 in control (T8) to 11237 kg ha-1 (T6) and significantly increased with increased N application. However, treatments T3 through T7 were on par with each other which received N ranging from 190 to 320 kg ha-1. The straw yields were also significantly low in T1 (RDF) which received 180 kg N ha-1 in 3 split doses when compared to the treatment T3 through T7 . These results are in conformity with those obtained by Mallikarjuna Swamy et al. (2016) and Shivakumar et al. (2017).
Harvest index (HI) of the different treatments was presented in Table 3. HI ranged from 33.5 in control (T8) to 43.1 in Green Seeker based NDVI ( T5 ). Treatments T2 to T7 were on par with each other. Harvest index of RDF ( T1 ) was lower (39.5) when compared to other treatments except control (T8) .
Additional net returns over RDF were calculated and presented in Table 4. B:C ratio was calculated based on the total fertilizer cost to the additional returns over RDF. B:C ratio was higher in T5 (3.32) followed by T3 (3.05) and T4 (2.92). Total fertilizer cost was high in T6 ( Rs 10516 ha-1 ) and T7 ( Rs 10071 ha-1 ). Gross returns were high in T5 (Rs 136940 ha-1) followed by T3 (Rs 133977 ha-1) . More cost of fertilizers in T6 and T7 over RDF resulted in lower B:C ratio. Similar findings were reported by Vikram et al. (2015) and Mallikarjuna Swamy et al. (2016). Umesh et al. (2014) also reported profitability of maize under SSNM based fertilizers application over blanket recommended fertilizers.
It is clear from the study that the LCC, SPAD and Green Seeker based nitrogen application can be advocated rather than blanket application. Timely and synchronized application of nitrogen fertilizers in small doses can give better yields rather than higher doses in lesser frequency.