
0 Views
G.R. SONIYA*, I. BHAVANI DEVI, B. APARNA AND B. RAMANA MURTHY
Department of Agricultural Economics, S.V. Agricultural College, ANGRAU, Tirupati.
ABSTRACT
The primary objective of this study is to assess the business performance of a selected Farmer Producer Organizations (FPOs) in Kurnool district of Andhra Pradesh. For this purpose, Two FPOs under Andhra Pradesh Rural Inclusive Growth Project (APRIGP) were selected and financial ratio analysis has been done on parameters such as liquidity, solvency, efficiency and profitability of the firm for the financial years 2017-18 to 2018-19. The study concluded that the Farmer Producer Organizations overall business performance is average. The performance scores of FPOs under APRIGP authority were falling in the yellow zone indicated an overall average performance. The FPOs had an average liquidity, solvency and efficiency performance while profitability also showed average performance. Hence, the study concluded that the overall FPOs performance under APRIGP was in the yellow zone
i.e. average performance and the score was 215.5.
KEYWORDS: Farmer producer organizations, liquidity, ratio analysis, solvency and profitability.
Indian agriculture is dominated by large number of fragmented land holdings. Small and marginal farmers own about 85% of the land holdings. Being unorganized, these small and marginal farmers are unable to reap high value for their produce and these issues can be mitigated by organizing them into Farmer Producer Organizations (FPOs) that allow farmers to reap the advantages of economies of scale by buying inputs, processing and marketing their products.
Farmer Producer Organisations (FPOs) are essential institutions for the empowerment, poverty alleviation and advancement of farmers and the rural poor. Politically, FPOs strengthens the political power of farmers, by increasing the likelihood that their needs and opinions are heard by policy makers and the public. Economically, FPOs can help to farmers gain skills, access inputs, form enterprises, process and market their products more effectively to generate higher incomes. In Andhra Pradesh, FPOs have linkages for marketing of produce, procurement and distribution of agricultural inputs. Knowledge linkages help farmers to access and adopt better agricultural practices through advisory and training services at different levels. Financial linkage with banks and other financial institutions helps access credit for working capital and other operational purposes. FPOs are helping make small holder farming viable and sustainable. FPOs are providing right input at right time at lower price to farmers (Garg, 2012) . In the year 2015, the government of Andhra Pradesh implemented APRIGP (Andhra Pradesh Rural Inclusive Growth Project) which is undertaken by SERP (Society for Elimination of Rural Poverty) in 150 most backward mandals representing all politico-agro-climatic regions of the state. In this project, 169 FPOs were setup in 13 districts.
The primary objective of this paper is to evaluate and analyse the business performance of Farmer Producer Organizations. In this study, an attempt has been made to evaluate the Farmer Producer Organizations under the authority of Andhra Pradesh Rural Inclusive Growth Project (APRIGP) in Kurnool district of Andhra Pradesh on the basis of liquidity, solvency, efficiency and profitability status from 2017-18 to 2018-19 i.e., two years.
Under the authority of APRIGP, there are 169 FPOs working in various districts of Andhra Pradesh. Among 13 districts, Kurnool district has 19 FPOs under APRIGP, these FPOs deal with input sales, procurement, marketing of major crops like paddy, redgram, bengalgram, groundnut, maize, cotton and sorghum. Some FPOs deal with vegetables and horticultural products. The scope of this study is limited to examine the financial performance of selected Two FPOs under APRIGP. The results cannot be generalized to all FPOs.
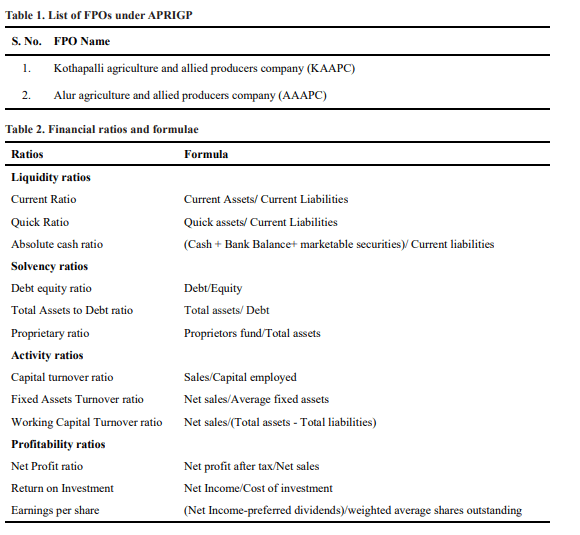
The study is based on secondary data. The data regarding audited annual financial statements like income statement, balance sheet from selected FPOs over a two year period from 2017-18 to 2018-19 was obtained. And also the data regarding the agro-economic aspects of the study area were collected from the District Chief Planning Officer, Kurnool district. The financial ratios were computed by establishing the relationship between the items of balance sheet and profit and loss account. Table 1 shows the list of Two FPOs under APRIGP taken up for study.
The financial ratios and formulae used presented in Table 2. The financial ratios and performance scores of 2 sample FPOs were calculated and discussed. A performance scorecard was prepared to evaluate Farmer Producer Organisationson the basis of their financial performance by scoring them against it. Performance score is given for each of the financial performance variable i.e., liquidity, solvency, efficiency and profitability and financial ratios under it to each of the FPOs. Deepali and Ship (2013) developed similar financial performance variables.
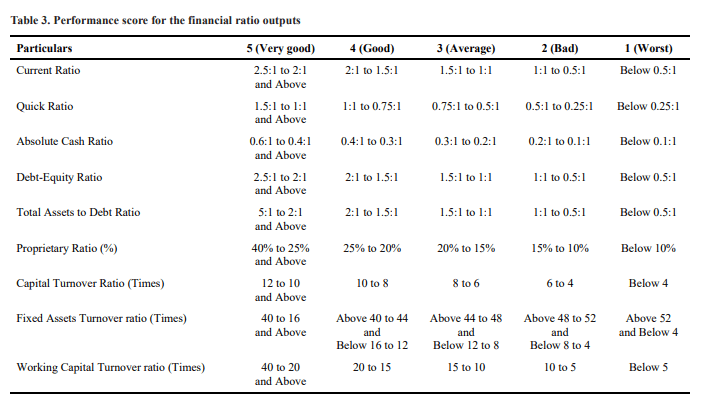
Five different performance clusters are classified based on the performance benchmark for each financial ratio i.e. 5, 4, 3, 2 and 1. Performance score 5 is the best score which is given when the financial ratio is in most optimum range and 1 being the worst. These performance scores will help us to assess whether the Farmer Producer Organisations financial performance is good, average or poor. Good FPOs are kept in green zone, average FPOs in yellow zone and poor FPOs in red zone. The performance score is based on the efficiency and effectiveness of the financial ratios derived from the Farmer Producer Organisations financial statements. Since, neither a low nor a high ratio shows the optimum level of performance as shown in Table 3.
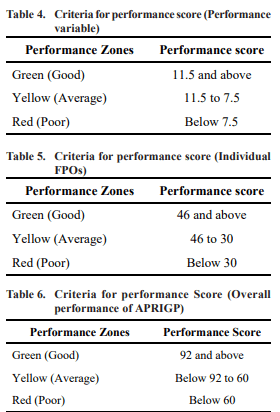
4. Under criteria for performance score for FPOs performance variables (liquidity, solvency, activity and profitability) it was 11.5 and above for green (good), 11.5 to 7.5 for yellow (average) and below 7.5 for red (poor). Under criteria for performance score for individual FPOs performance, it was 46 and above for green (good), 46 to 30 for yellow (average) and below 30 for red (poor) as shown in Table 5. Similar performance score for FPOs was developed by Shivam and Arup (2017).
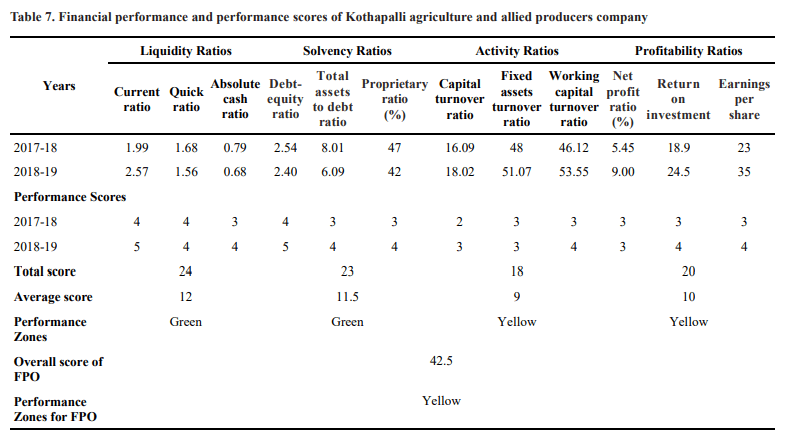
Information regarding financial particulars from 2017-18 to 2018-19 were obtained from balance sheet and profit loss account of Kothapalli agriculture & allied producers company. The financial ratios were computed and presented in Table 7.
Table 7 indicated that current ratios from 2017-18 to 2018-19 were 1.99 and 2.57 respectively. This indicated that an increasing trend was observed in current ratios from 2017-18 to 2018-19. The quick ratios from 2017-18
to 2018-19 were 1.68 and 1.56 respectively indicating a decreasing trend from 2017-18 to 2018-19. The absolute cash ratios from 2018 to 2019 were 0.79 and 0.68 respectively. This inferred that a decreasing trend was observed in absolute cash ratios from 2017-18 to 2018-19. The average performance score of the FPO for liquidity position was 12 falling in green zone and considered to be good. Similar results were also recorded by Vishwanath (1994).
The debt equity ratios of the FPO from 2017-18 to 2018-19 were 2.54 and 2.4 respectively which showed that the FPO’s dependency on outside lenders was declining. The total assets to debt ratios of the FPO from 2017-18 to 2018-19 were 8.01 and 6.09 respectively. This inferred that a decreasing trend from 2017-18 to 2018-19 revealing that their creditors are covered by their assets and they can be paid off as and when needed by realising their assets. Proprietary ratios of the FPO from 2017-18 to 2018-19 were 47 per cent and 42 per cent respectively. This indicated that the FPO depended on the equity capital to finance their assets. The average performance score of the FPO for solvency position was 11.5 falling in green zone and considered to be good.
Capital turnover ratios of the FPO from 2017-18 to 2018-19 were 16.09 and 18.02 respectively. The
increasing trend for two years indicated that on an average 16 and 18 times in two years where capital was being converted into sales. The fixed assets turnover ratios of the FPO from 2017-18 to 2018-19 were 48 and 51.07 respectively. This inferred that an increasing trend was observed in fixed assets turnover ratios from 2017-18 to 2018-19 which indicated that the FPO was utilising its fixed assets more effectively. Working capital turnover ratios of the FPO from 2017-18 to 2018-19 were 46.12 and 53.55 respectively. The increasing trend for two years indicated that high ability to generate sales per rupee of working capital by the FPO. The average performance score of the FPO for efficiency was 9 falling in yellow zone and considered to be average. This was in conformity with Garg (2012).
Net profit ratios of the FPO from 2017-18 to 2018- 19 were 5.45 per cent and 9 per cent respectively. This indicated that an increasing trend was observed in net profit ratios from 2017-18 to 2018-19. Return on investment of the FPO from 2017-18 to 2018-19 were 18.9 and 24.5 respectively. This indicated an increasing
trend in return on investment from 2017-18 to 2018-19 thus indicating a higher ability to generate profits from per rupee of capital employed. Earnings per share of the FPO from 2017-18 to 2018-19 were 23 and 35 respectively. This indicated an increasing trend in earnings per share from 2017-18 to 2018-19 The average performance score of the FPO for profitability was 10 falling in yellow zone and considered to be average. Overall score of FPO was 42.5 falling in yellow zone and to be average. The finding were in line with Adrian and Green (2001).
Financial performance of Alur agriculture and allied producers company Information regarding financial particulars from 2017-18 to 2018-19 were obtained from balance sheet and profit loss account of Alur agriculture & allied producers company. The financial ratios were computed and presented in Table 8.
A perusal of Table 8 shows that current ratios from 2017-18 to 2018-19 were 1.89 and 2.23 respectively. This indicated that an increasing trend was observed in current ratios from 2017-18 to 2018-19. The quick ratios from
2017-18 to 2018-19 were 1.67 and 1.53 respectively indicating that a decreasing trend from 2017-18 to 2018-
19. The absolute cash ratios from 2017-18 to 2018-19 were 0.77 and 0.56 respectively. This inferred that a
decreasing trend was observed in absolute cash ratios from 2017-18 to 2018-19. The average performance score of
the FPO for liquidity position was 12.5 falling in green zone and considered to be good. Similar results were reported by Vishwanath (1994).
The debt equity ratios of the FPO from 2017-18 to 2018-19 were 3.67 and 3.11 respectively which indicated
that the FPO’s dependency on outside lenders was decreasing. The total assets to debt ratios of the FPO from
2017-18 to 2018-19 were 8.58 and 6.12 respectively. This inferred that a decreasing trend from 2017-18 to 2018-19
indicated that their creditors are covered by their assets and they could be paid off as and when needed by realising
their assets. Proprietary ratios of the FPO from 2017-18 to 2018-19 were 45 per cent and 36 per cent respectively.
This indicated that the FPO depended on the equity capital to finance their assets. The average performance score of
the FPO for solvency position was 10.5 falling in yellow zone and considered to be average.
Capital turnover ratios of the FPO from 2017-18 to 2018-19 were 15.77 and 17.0 respectively. The increasing
trend for two years indicated that on an average 16 and 17 times in two years where capital was being converted
into sales. The fixed assets turnover ratios of the FPO from 2017-18 to 2018-19 were 48 and 50.21 respectively. This inferred that an increasing trend was observed in fixed assets turnover ratios from 2017-18 to 2018-19 which revealed that the FPO was using its fixed assets more effectively. Working capital turnover ratios of the FPO from 2017-18 to 2018-19 were 46.88 and 50.02 respectively. The increasing trend for two years indicated that high ability to generate sales per rupee of working capital by the FPO. The average performance score of the FPO for efficiency was 11 falling in yellow zone and considered to be average. These results were in line with the findings of Garg (2012).
Net profit ratios of the FPO from 2017-18 to 2018- 19 were 6.4 per cent and 12 per cent respectively. This indicated that an increasing trend in net profit ratios from
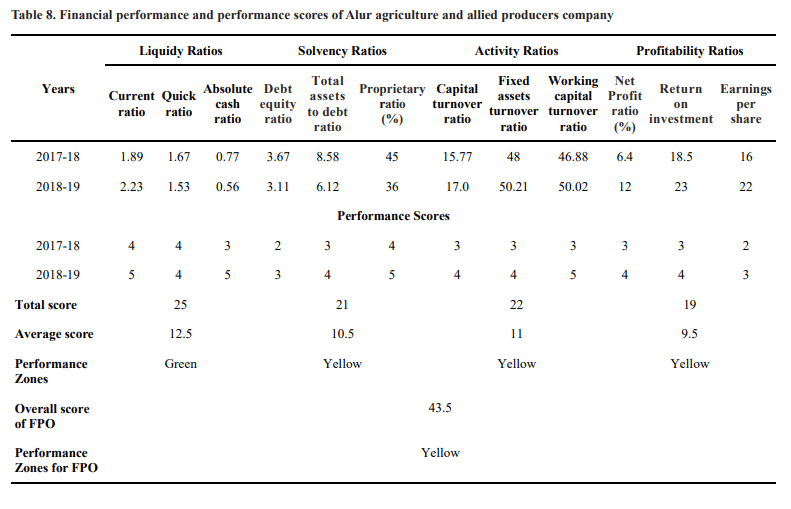
2017-18 to 2018-19 Return on investment of the FPO from 2017-18 to 2018-19 were 18.5 and 23 respectively. This indicated an increasing trend was observed in return on investment from 2017-18 to 2018-19 that indicating a higher ability to generate profits from per rupee of capital employed. Earnings per share of the FPO from 2017-18 to 2018-19 were 16 and 22 respectively. This indicated an increasing trend in earnings per share from 2017-18 to 2018-19. The average performance score of the FPO for profitability was 9.5 falling in yellow zone and considered to be average. Overall score of FPO was 43.5 falling in yellow zone and to be average.
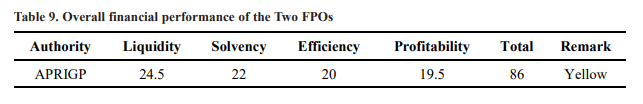
The study concluded that the Farmer Producer Organizations overall business performance was average. The performance scores of FPOs under APRIGP authority were falling in the yellow zone indicated an overall average performance. The FPOs had an average liquidity, solvency and efficiency performance while profitability also showed average performance with the respective score of 24.5, 22, 20 and 19.5. Hence, the study concluded that the overall FPOs performance under APRIGP was in the yellow zone i.e. average performance and the score was 86 (Table 9).
The business performance of Kothapalli Agriculture and Allied Producers Company and Alur Agriculture and Allied Producers Company was found average. The overall FPO’s business performance under APRIGP was in the yellow zone i.e. average. The two FPOs need to focus all the financial parameters such as liquidity, solvency, efficiency, profitability to improve their performance from average to good category. And especially for their overall performance FPOs need to focus on efficiency and profitability parameters.
Adrian, J.L and Green, T.W. 2001. Agricultural cooperative managers and the business environment. Journal of Agribusiness. 19(1): 17-34.
Deepali, K.S and Ship, S. 2013. Comparative Analysis of Financial Performance of Indian Farmers Fertilisers Cooperative Ltd. (IFFCO). International Journal of Business and Management Research. 3(6): 2319-2480.
GARG, T. 2012. Business performance of a producer company in Madhya Pradesh. MBA(ABM) Project Report, (Unpub.), University of Agricultural Sciences, Bangalore.
Shivam, K and Arup, R. 2017. A study on the financial performance of Farmer Producer Companies with special reference to North-East India. Amity Journal of Agribusiness. 2(1): 37-56.
Vishwanath, A.K.R. 1994. Financial Performance of Co- operative Banks-A case study. Agriculture Banker. 18 (2):17-26.