
0 Views
G. NAVEEN*, V. UMAMAHESH, A. R. NIRMAL KUMAR and Y. REDDI RAMU
Department of Crop physiology, S.V. Agricultural College, ANGRAU, Tirupati – 517502, Chittoor Dt., A.P., India
A field experiment was carried out during kharif, 2018 on sandy clay loam soils of wet land farm of S. V. Agricultural College, Tirupati, Acharya, N. G. Ranga Agricultural University. The experiment was laid out in factorial randomized block design with three dates of sowings (1st fortnight of June, 1st fortnight of July, 1st fortnight of August), four varieties (MTU-1010, NLR-34449, BPT-5204 and NLR-3041) and replicated thrice. More number of days taken to attain 50% flowering 1st fortnight of June sowing (108) followed by 1st fortnight of July sowing and 1st fortnight of August sowing. Among varieties more number of days taken to attain 50% flowering in NLR- 3041 (107) followed by BPT-5204, NLR-34449 and MTU-1010. With every delay in sowing there was a decline in accumulation of growing degree days and photothermal units, this leads to decrease the time taken to attain 50% flowering. The highest accumulation of growing degree days (2218.38oC day) and photothermal units (26098.71oC day hr) in 1st fortnight of June sowing from sowing to harvest followed by 1st fortnight of July sowing and 1st fortnight of August sowing. Among the varieties highest accumulation of growing degree days (2136.83oC day) and photothermal units (25830.56oC day hr) in NLR- 3041 from sowing to harvest followed by BPT-5204, NLR-34449 and MTU-1010.
Growing Degree Days and Photothermal Units
Rice is one of the world’s staple cereal along with wheat and maize. More than three billion people across the globe eat rice every day. The grain makes up 20 per cent of the world’s dietary energy supply more than wheat (19 per cent) and maize (5 per cent) and is the number one staple food for the world’s poorest and undernourished people. Temperature and photoperiod are key factors affecting crop phenology. The commonly used weather based agro indices based on temperature and photoperiod are growing degree days (GDD) and photothermal units (PTU). Effect of agro indices physiology of rice crop and its corresponding influence on phenology needs a deeper understanding to make the system more productive.
The field experiment was conducted at S.V. Agricultural College Farm, Tirupati campus of Acharya N. G. Ranga Agricultural University in kharif, 2018.
The weekly mean maximum temperature during the crop growing period ranged from 28.0 to 37.4°C, with an average of 32.7ÚC. The weekly mean minimum temperature during the crop period ranged from 17.6 to 27.6°C, with an average of 22.6°C.
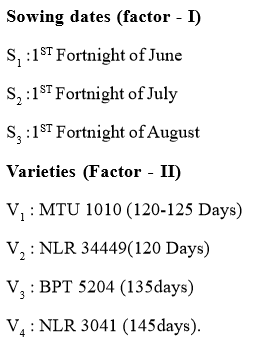
The field experiment was laid out in Factorial Randomized Block Design (FRBD). Treatments of the experiment mainly include two factors viz., sowing dates (factor – I) and varieties (factor – II).
The field experiment was conducted at S.V. Agricultural College Farm, Tirupati campus of Acharya N. G. Ranga Agricultural University in kharif, 2018.
The weekly mean maximum temperature during the crop growing period ranged from 28.0 to 37.4°C, with an average of 32.7ÚC. The weekly mean minimum temperature during the crop period ranged from 17.6 to 27.6°C, with an average of 22.6°C.
The field experiment was laid out in Factorial Randomized Block Design (FRBD). Treatments of the experiment mainly include two factors viz., sowing dates (factor – I) and varieties (factor – II).
The crop was provided with fertilizers at the rate
of 50:24:16 N: P: K kg acre-1. The entire P was applied as basal, K in two splits of equal amounts first as basal and second split at panicle initiation. Nitrogen is given in three splits of equal amounts, first split at 15 days after sowing, second split at tillering stage and the third split at panicle initiation stage. The seed was sown at a spacing 20cm × 15cm. The used seed rate was 35 kg ha-1.
Environmental Parameters (Heat Units)
Photothermal unit (PTU) (oC day hour)
PTU is calculated by multiplying GDD maximum possible sunshine hours or with day length (hrs) (Major et al, 1975).
PTU = GDD X Maximum possible sunshine hours or Day length
Growing Degree Days (GDD) (oC days)
The growing degree days was computed by Nuttonson,
(1955) using following formula:
GDD = Σ [(Tx + Tn)/2 – Base temperature] Where,
Tx = Daily maximum temperature Tn = Daily minimum temperature
The base temperature is defined as, “The temperature below which no plant physiological activity takes place” which is considered 10oC for rice crop.
Heliothermal Unit (HTU) (oC day hour)
HTU is calculated by multiplying GDD with duration of sunshine hours (Rajput, 1980 &Sastry and Chakravarthy, 1982).
HTU = GDD X Bright sunshine hours RESULTS AND DISCUSSION Days to 50% flowering
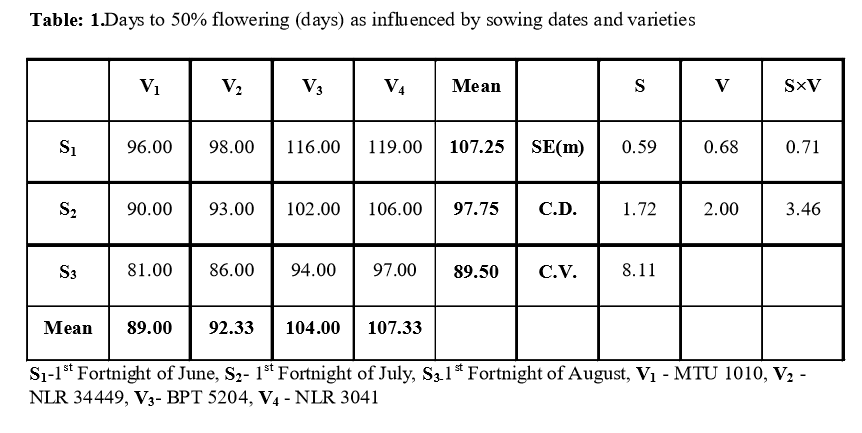
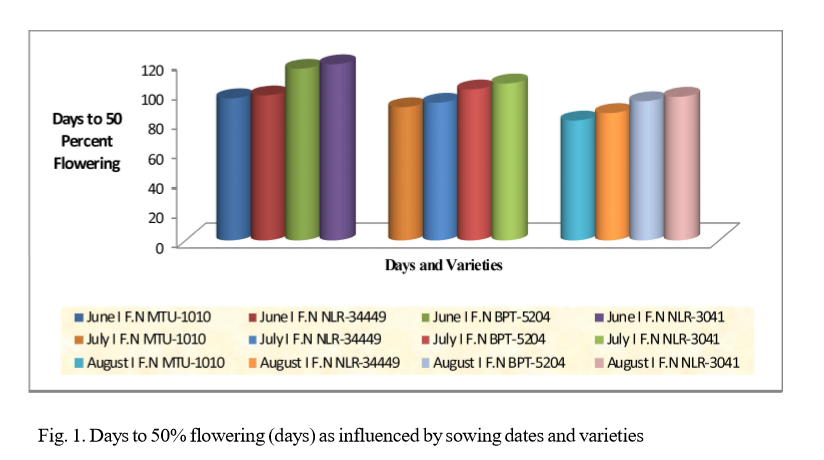
The data on days to 50% flowering was presented in Table 1 and Fig. 1.
Significant difference in days to 50% flowering was observed between the dates of sowing and varieties and their interaction. Among sowing dates, there was reduction in days to 50% flowering with every fortnight delay in sowing. More number of days to 50% flowering was observed with 1st fortnight of June sowing (107.25) compared to that of 1st fortnight of July (97.75) and 1st fortnight of August (89.50) sowing.
Between the varieties the days to 50% flowering in NLR-3041 (107.33) was significantly highest and superior to that of BPT-5204 (104.00), NLR-34449 (92.33) and MTU-1010 (89.00).
With regard to interaction, the days to 50% flow-ering was significantly more (119.00) with NLR-3041 sown on 1st fortnight of June which is on par with BPT-5204 (116.00) sown on 1st fortnight of June compared to all other treatment combinations. In all dates of sowings NLR-3041 was on par with BPT-5204. In all dates of sowings NLR-34449 was on par with MTU-1010 except at 1st fortnight of August sowing. Significantly lower days to 50% flowering (81 .00) were produced with MTU-1010 sown on 1st fortnight of August which was on par with NLR-34449 (84.00) under same date of sowings. With every delay in sowing there was a decline in accu-mulation of growing degree days and photothermal units (Table 2), this leads to decrease the time taken to attain 50% flowering. The highest accumulation of growing de-gree days (2218.38oC day) and photothermal units (26098.71oC day hr) in 1st fortnight of June sowing from sowing to harvest followed by 1st fortnight of July sowing and 1st fortnight of August sowing. Among the varieties highest accumulation of growing degree days (2136.83oC day) and photothermal units (25830.56oC day hr) in NLR-3041 from sowing to harvest followed by BPT-5204, NLR-34449 and MTU-1010. Similar results were also revealed by Satish et al. (2017) and Abhilash et al. (2017).
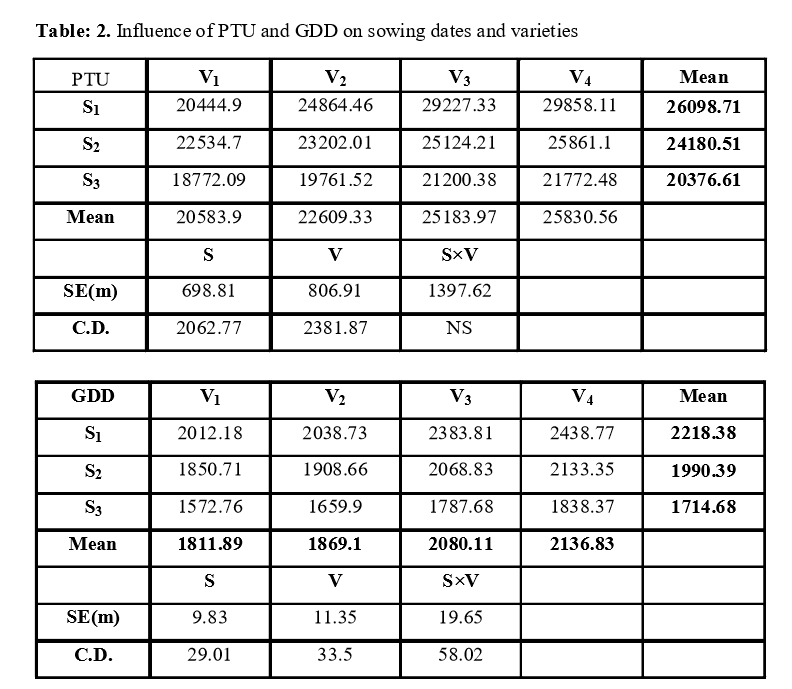
S1-1st Fortnight of June, S2- 1st Fortnight of July, S3-1st Fortnight of August, V1 – MTU 1010, V2 – NLR 34449, V3- BPT 5204, V4 – NLR 3041, GDD- Growing Degree Days, PTU- Photothermal Unit
In conclusion, the present study indicated that sowing of NLR-3041 during 1st fortnight of June to get more number of days taken to attain 50 per cent flowering this leads more number of days taken to complete vegetative stage.