
0 Views
Institute of Agribusiness Management, ANGRAU-S.V. Agricultural College, Tirupati-517 502.
The study was undertaken to analyse the growth trends in onion cultivation across India during the period 2014-15 to 2023-24 using secondary data sourced from the Directorate of Economics and Statistics. Compound Annual Growth Rate (CAGR), Coefficient of Variation (CV) and Cuddy Della Valle Instability Index were employed to assess long term trends and year to year fluctuations in area, production and productivity. The results revealed a positive growth in all three parameters: area expanded at a CAGR of 1.58 per cent, production increased by 2.67 per cent and productivity improved marginally at 1.05 per cent. The Coefficient of Variation was 6.84 per cent for area, 10.42 per cent for production and 8.97 per cent for productivity indicating moderate variability. Instability indices suggested relatively higher fluctuations in production compared to area and productivity. The findings reflect a consistent but moderate improvement in India’s onion sector with scope for yield enhancement through improved agronomic and post harvest practices.
KEYWORDS: Onion, growth trend, CAGR, instability, India, production.
Onion (Allium cepa L.) is one of the most widely cultivated and consumed vegetable crops in India, playing a vital role in the daily diet of millions as well as in the country’s agricultural economy. Renowned for its pungency and flavour-enhancing properties, onion holds a significant position not only in domestic consumption but also in processing and exports (APEDA, 2024; UN COMTRADE, 2024). India ranks second in global onion production after China (FAO, 2024), with production primarily concentrated in the states of Maharashtra, Madhya Pradesh, Karnataka, Gujarat, Rajasthan, and Andhra Pradesh (Department of Agriculture and Farmers Welfare, 2024).
Over the past decade, the onion sector has witnessed dynamic changes influenced by market fluctuations, climatic variability, policy interventions, and infrastructural developments (Baviskar et al., 2022; Nalegaonkar et al., 2020). Despite its importance, the sector continues to face challenges in terms of price volatility, production instability, and storage inefficiencies (DGCI&S, 2024). Hence, a comprehensive understanding of its growth performance over time is crucial for informed policymaking and supply chain improvements.
In this context, the present study was undertaken to analyse the growth trends in onion area, production, and productivity at the national level during the period 2014–15 to 2023–24. The analysis utilizes the Annual Growth Rate (AGR) to assess yearly variations, Compound Annual Growth Rate (CAGR) to evaluate long-term trends, along with the Coefficient of Variation (CV) and Cuddy Della Valle Instability Index (CDVI) to capture year-to-year fluctuations (Department of Agriculture and Farmers Welfare, 2024; FAO, 2024). The findings aim to offer insights into the pace and stability of onion production growth, thereby contributing to strategic planning for enhancing production and reducing volatility in the supply chain.
The present study is based on secondary data for the period from 2014-15 to 2023-24 pertaining to onion cultivation in India. The data on area (hectares), production (metric tonnes) and productivity (tonnes per hectare) were collected from authentic sources including the Directorate of Economics and Statistics (DES), Ministry of Agriculture and Farmers Welfare, Government of India. To analyze short term fluctuations, the Annual Growth Rate (AGR) was computed for quantity, value and unit value. The AGR indicates the year on year percentage change and was calculated using the following formula:

where Et is the value in the current year and Et−1 is the value in the previous year.
To capture long term trends, the Compound Annual Growth Rate (CAGR) was calculated. CAGR provides the average annual rate of change over the study period by smoothing out year to year fluctuations. It was computed using the formula:

where Vf and Vi denote the final and initial year values respectively and n is the number of years.
To assess the variability, the Coefficient of Variation (CV) and the Cuddy Della Valle Instability Index (CDVI) were employed. While CV measures relative variability, the CDVI corrects for the presence of a time trend, offering a more realistic measure of instability. The CDVI was calculated using the formula:
Instability Index= C.V. × √1 − 𝑅2
where R2 is the coefficient of determination from a linear trend regression and CV is the standard deviation expressed as a percentage of the mean.
The performance of onion cultivation in India over the period 2014-15 to 2023–24 has been analysed in terms of area, production and productivity. A decadal analysis provides insight into structural changes and growth trends in the sector. To quantify the rate of growth over time, Compound Annual Growth Rate (CAGR) and Annual Growth Rate (AGR) were computed. While CAGR captures the long term average growth on a compounded basis, AGR provides a yearly variation estimate reflecting short term changes.
These growth rates help differentiate whether increases in production are primarily driven by area expansion or improvements in productivity. Moreover, evaluating both AGR and CAGR together gives a balanced perspective on the stability and sustainability of growth patterns.
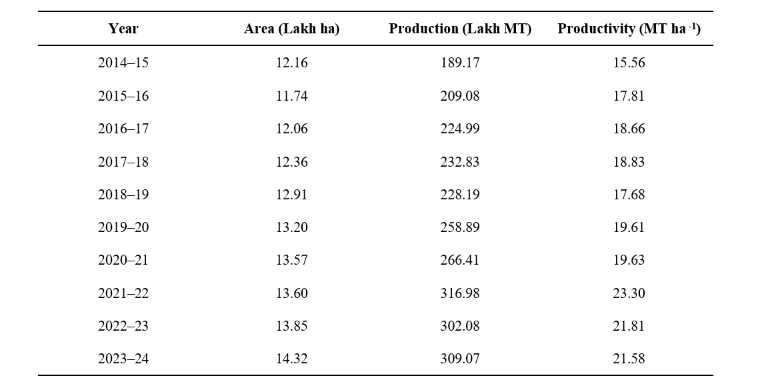
The yearly values of onion area, production and productivity across the study period are shown in Table 1 below.
As shown in Table 1 the area under onion cultivation increased from 12.16 lakh hectares in 2014-15 to 14.32 lakh hectares in 2023-24. Correspondingly, production rose from 189.17 lakh metric tonnes to 309.07 lakh metric tonnes. Productivity improved from 15.56 MT ha-1 to 21.58 MT ha-1 over the same period indicating technological advancements and better agronomic practices.
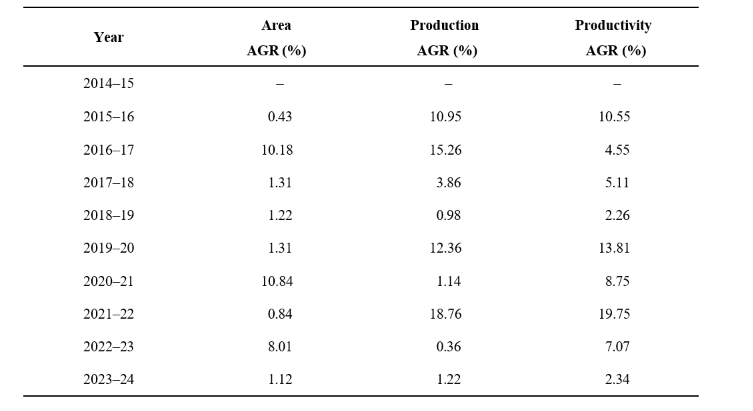
The AGR values exhibited inter annual fluctuations. For instance, production witnessed a sharp increase in 2021-22 due to favourable climatic conditions and government incentives followed by a decline in 2022-23 . These fluctuations reflect the crop’s vulnerability to weather, market shocks and storage limitations.
The CAGR for the decade was estimated at 1.87 per cent for area, 5.63 per cent for production and 3.75 per cent for productivity highlighting a stronger growth in output and efficiency than in land expansion. This suggests that productivity gains contributed significantly to overall growth.
The production of onion in India recorded a CAGR of 5.54 per cent, which is relatively higher than the CAGR of 1.85 per cent for area, indicating that the increase in output is largely attributable to gains in productivity rather than area expansion. Productivity itself showed a CAGR of 3.61 per cent, supporting the role of technological adoption and improved practices. The AGR values reflected short term fluctuations influenced by climatic conditions, policy interventions and market factors.
The instability in area, production and productivity was estimated using Coefficient of Variation (CV) and Cuddy Della Valle Index (CDVI) to understand the consistency of growth during the study period. The findings are presented in Table 4 provided below.
Instability in area, production, and productivity was estimated using CV and CDVI (Table 4). Area exhibited low variability (CV: 5.77%; CDVI: 4.39%), reflecting stability in land allocation (Department of Agriculture and Farmers Welfare, 2024). Production (CV: 14.42%; CDVI: 11.92%) and productivity (CV: 11.98%; CDVI: 9.21%) showed moderate instability, likely influenced


by erratic rainfall, pest infestations, and market volatility (Baviskar et al., 2022; Nalegaonkar et al., 2020).
The growth trend analysis of onion in India from 2014–15 to 2023–24 shows a positive trajectory in production and productivity, with production increasing at a CAGR of 5.54 per cent outpacing area expansion. Productivity gains reflect the increasing efficiency and intensification of onion cultivation systems (FAO, 2024; Department of Agriculture and Farmers Welfare, 2024). Moderate instability in production and productivity persists due to biotic and abiotic stressors (Baviskar et al., 2022; Nalegaonkar et al., 2020). The findings underscore the importance of sustaining technological and policy interventions to further stabilize and enhance onion productivity, ensuring long-term supply security and farmer profitability (APEDA, 2024).
Agricultural and Processed Food Products Export Development Authority. 2024. AgriExchange: Onion export data (2014–2024). Agricultural and Processed Food Products Export Development Authority. Ministry of Commerce and Industry. Government of India.
Baviskar, P.V., Bhor, A.S and Chole, R.R. 2022. Growth and instability in onion export from India. Journal of Pharmacognosy and Phytochemistry. 11(5): 340–342.
Department of Agriculture and Farmers Welfare. 2024. Horticultural Statistics at a Glance: Onion Area and Production Data. Department of Agriculture and Farmers Welfare. Ministry of Agriculture and Farmers Welfare. Government of India.
Directorate General of Commercial Intelligence and Statistics .2024. Export Import Data Bank: Onion trade statistics. Directorate General of Commercial Intelligence and Statistics. Ministry of Commerce and Industry. Government of India.
Food and Agriculture Organization of the United Nations. 2024. Food and Agriculture Data. Food and Agriculture Organization of the United Nations.
Nalegaonkar, K.S., Chavan, U.D., Patil, J.V and Pawar, S.S. 2020. Trend and instability analysis of onion exports in India. International Journal of Chemical Studies. 8(1): 311–314.
United Nations International Trade Statistics Database (UN COMTRADE). 2024. UN COMTRADE
Database. United Nations.