
0 Views
Forecasting models were helpful for managing and decision making in planning for the future effectively. This paper
attempted forecasting univariate time series of banana production in India, the proposed Auto Regressive Integrated Moving Average (ARIMA) algorithm appears more powerful than traditional models. Used 69 years data banana production (1951-2019) in India and applied time series ARIMA model. This paper forecasts of banana production in India for the year 2020-2025.
Time series forecasting, ARIMA, banana production.
Among the Fruit crops, banana (Musa sp.) is one of the significant tropical fruit crops and plays key role in the economy of many developing counters. These Fruit crops generate employment in particularly rural areas as well as overall economic growth. After the wheat and maize production, banana is the fourth most important food commodity in the world. Banana contributes to the food security of millions of the people in majority of the developing countries.
Normally, univariate time series is an order of observations of the same random variable at different
times. Usually, time series data fluctuating based on the time and other influential parameter. The objective of the univariate time series data is to predict upcoming values of the given variable and its behaviour in the past trend. Time series model (ARIMA) are used to forecast methodology by using the past data to forecast the upcoming with help of recognizing the trend and patterns within the data.
Khan et al. (2008) and Qureshi (2014) used forecasted models for mango production of Pakistan.Rathod et al. (2011), Narayanaswamy et al. (2012a), Narayanaswamy et al. (2012b) and Pardhi et al. (2016)
used multiple linear regression analysis to study the effect of agricultural inputs and weather parameters on agricultural and horticultural crops. Naveena et al. (2014) applied different type of time series models to predict the coconut production of India. Swathi and Nafeez(2016) attempts to study the pattern of Rabi cereals production, using ARIMA in Andhra Pradesh. Nafeez Umar and Zeeshan (2019) applied ARIMA models to study and measure the volatility of selected emerging indices of Muscat Securities Market (MSM).
Yearly data on production (000’MT) of banana crop from 1951-2019 in India were collected from
www.indiastat.com. Of the 69 yearly data used in ARIMA model and check the performance of ARIMA (p, d, q) models based on the residual errors. The Statistical Packages R-Programing and SPSS were used for
modelling and forecasting banana production time series in India. The Hyndman-Khandakar algorithm for
automatic ARIMA modelling were used for identifying the appropriate ARIMA (p, d, q) model.
The three important stages of building of ARIMA model is identification, estimation and diagnostics
checking of the models. Initially, identification of ‘d’ (Number of differences) is necessary to make a nonstationary to stationary. Commonly, Augmented Dickey Fuller test us utilized to test the stationary. In the estimation stage, the parameters are estimated and identified employing maximum likelihood techniques. Finally, the auto arima function in R programing uses a combine’s unit root tests for stationarity checking, minimisation of the Akai’e Information Criteria (AIC) and Maximum Likelihood Estimation (MLE) to obtain the ARIMA model. It is providing many variations of algorithms of ARIMA (p, d, q) models.
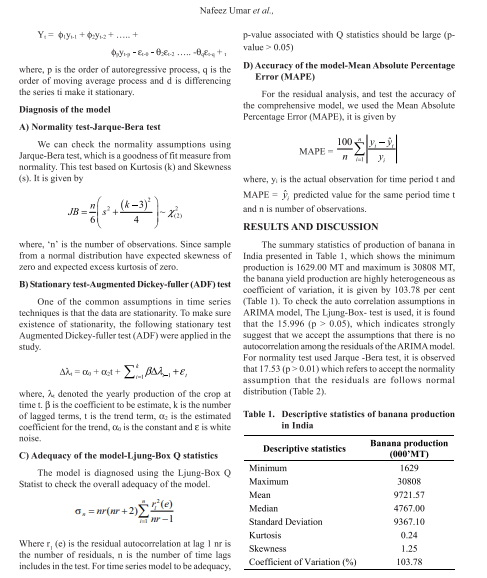
The general ARIMA (p d q) model is
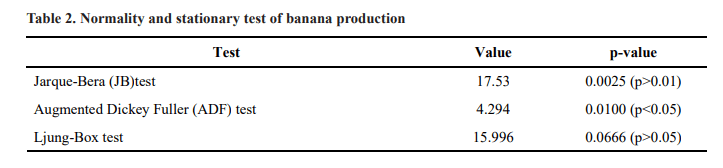
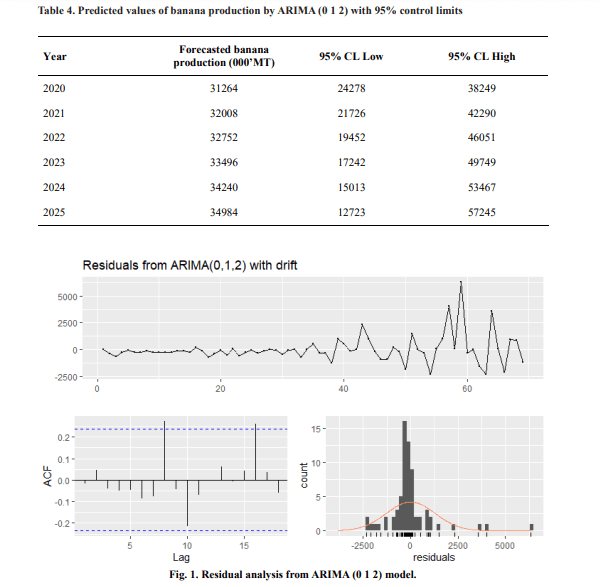
We observed that the residuals are follows normally distributed, So it can be said that the banana production time series data good fitted for the model, again the Histogram of the residuals of banana production is also normally distributed (Fig. 1). In ARIMA model, to check the stationarity of time series banana production series,Augmented Dickey Fuller test is used. From this unit root test is, it is clearly shown stationarity condition satisfied at the difference order one.
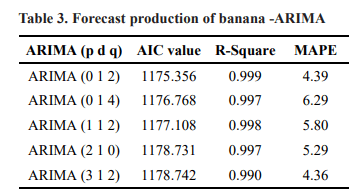
An ARIMA model was built using HyndmanKhandakar algorithm for automatic ARIMA function in R-software for banana production. Analysed various combinations of Time series ARIMA models, the best selected ARIMA model based on Low Akai Information Criteria (AIC), Low Mean Absolute Percentage Error (MAPE) and High R-square value to forecast the banana production in India is ARIMA (0 1 2) with AIC value is
1175.356, High R-Square is 0.999 and Low Mean Absolute Percentage Error (MAPE) is 4.39. When we compared other models the AIC values and the R-Square values, not much variation among the values. The only object is the MAPE is vary from the ARIMA models.
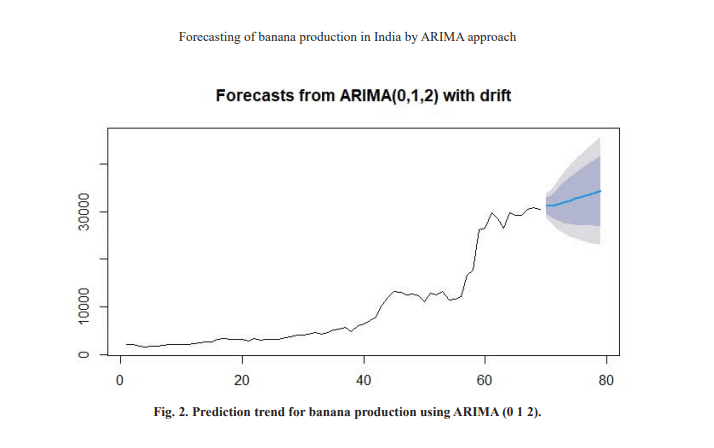
For the forecasted of banana production in India, we predict in the year 2020 to 2025. We observed
continuous growing banana production in India from 2020 to 2025. In the year 2020 we predict 31264 MT with 95 per cent confidence level (Low = 242478, High = 38249)
(Table 4 and Fig. 2). Finally, considering all of the formal and graphical test, it is obvious that the fitted mode ARIMA (0, 1, 2) is best fitted model for forecasting banana production in India.
Time series models is used for patterns in the past data of variable and uses that information to forecast the upcoming values. To select the best model for forecasting the banana production in India, we used several criteria of selection of the fitted models such as High R-Square, Low AIC value and Low MAPE value. In this present study, we forecast of the banana production in India for the year 2020 to 2025. The fitted ARIMA (0 1 2) model for banana production in yearly basis. These forecasting
models might be used to take a decision to a researcher, policy makers. Fruits products and Businessmen covering the whole India. This time series model is very helpful for farmers, organizations for future trends.
Akaike, H. 1974. A new look at the statistical model
identification. IEEE Transactions on Automatic
Control. 19(6): 716-723.
Hamjah, M.A., 2017. Forecasting major fruit crops
production in Bangladesh using Box-Jenkins
ARIMA model. Journal of Economics and
Sustainable Development. 5(7): 96-107.
Narayanaswamy, T., Surendra, H.S and Rathod, S. 2012a.
Multiple stepwise regression analysis to estimate root
length, seed yield per plant and number of capsules
per plant in sesame (Seasamum indicum L.). Mysore
Journal of Agricultural Sciences. 46(3): 581-587.
Narayanaswamy, T., Surendra, H.S and Rathod, S. 2012b.
Fitting of statistical models for growth patterns of
root and shoot morphological traits in sesame
(Seasamum indicum L.). Environment and Ecology.
30(4): 1362-1365.
Naveena, K., Rathod, S., Shukla, G and Yogish, K.J. 2014.
Forecasting of coconut production in India: A
Suitable Time Series Model. International Journal
of Agricultural Engineering. 7(1): 190-193.
Qureshi, M.N. 2014. Modelling on mango production in
Pakistan. Science International. (Lahore). 26(3):
1227-1231.
Ramesh, D., Bhattacharyya, B and Biswas, R. 2014.
Forecasting of maize production in Andhra Pradesh
by ARIMA modelling. Environment and Ecology.
32(4B): 1709-1713.
Rathod, S., Surendra, H.S., Munirajappa, R and
Chandrashekar. H. 2011. Statistical assessment on
the factor influencing agricultural diversification in
different districts of Karnataka. Environment and
Ecology. 30(3A): 790-794.
Swathi, K.S and Umar, Sk.U. 2016. Forecasting of Rabi
cereals production in Andhra Prdesh using ARIMA
models. International Journal of Engineering
Science and Computing. 6(7): 8275-8277.
Nafeez U.Sk and Zeeshan, L.M. 2019. Modelling monthly
volatility of the Muscat Securities Market (MSM)
index using Auto Regressive Integrated Moving
Average (ARIMA). Journal of Business and
Economics. 10(11): 1045-1056.