
0 Views
K. REVATHI*, S. RAJESWARI, N. VANI AND G. MOHAN NAIDU
Department of Agricultural Economics, S.V. Agricultural College, Tirupati, A.P. 517 502
Financial inclusion played a major role in driving away the poverty from the country. Financial inclusion is the process of ensuring access to appropriate financial products and services needed by all section of society in general and vulnerable groups such as weaker sections and low income groups in particular, at an affordable cost and in a faire and transparent manner by regulated mainstream institutional players. Present investigation was done to study the Financial inclusion in Chittoor district of Andhra Pradesh. The objective of the study was assessing the level of financial knowledge, attitude and behaviour of rural households. The NAFIS frame work was used. The study revealed that 42.85 per cent of agricultural households and about 50.00 per cent non-agricultural households were found to be have good financial literacy.
Financial inclusion, Financial products and Financial literacy.
A good awareness level of households regarding various financial services has an important place in the mission of inclusive financing. India is a developing nation and it is very essential to build up a strong format of capital formation in Indian economy. The strong set up of capital formation can be rationalized through efficient knowledge and awareness of wide varieties of financial services both in rural and urban areas for making the India as a developed country. Even after introducing several varieties of financial services by mutual efforts of Government of India (GOI) and Reserve Bank of India (RBI), still households are not so aware about distinction between formal and informal sources of finance because of financial illiteracy (Sharma and Singh, 2016). So that, they are inefficient in invest their amount of savings in a right path and this weakness can be removed through providing effective financial literacy programs across the country. The household savings is very essential for economic development of any country because through this the money is circulating in economy from one sector to another sector and household savings helps in nation building and improving the growth of GDP and also provide the main source of investment financing to government and corporate sectors. That’s why it reduces the overtake of informal sources of finance i.e.
Money lenders and the efficiency and welfare of the poor people can be enhanced by providing avenues to secure and safe saving practices and facilitates a whole range of efficient financial services (Garg and Agarwal, 2014).
Financial Literacy empowers individuals and helps them to lead a better financial life. It helps individuals to prepare for difficult time by mitigating risk and effectively using financial products to make rational financial decisions. Financial Literacy is relevant for all sections of the society like resource poor population, lower and middle income groups, high net worth individuals, financial institutions, and policy makers. Financial institutions and other stakeholders are taking initiatives to promote financial literacy. Financial institution should not restrict them in just creating a buzzword about financial literacy. The goal of financial literacy will be attained when large number of individuals would be aware about basic financial concepts, understand the key features of financial products, develop skills and confidence related to financial matters. Financial Literacy is one of the major challenges faced by countries across the globe, irrespective of their level of economic development. Foundation for financial literacy can be laid by inculcating financial prudence through education at school and college level, organizing workshops for youth and retired persons. The present study focuses on understanding the level of financial literacy among individual households.
A multistage random sampling technique was employed for the present study. Chittoor district was selected purposively as it is one of the agriculturally advanced districts of Rayalaseema region of Andhra Pradesh. From the district, ten villages were selected based on the following criteria, which was followed by NABARD All India Rural Financial Inclusion Survey 2016-17.
1. Villages with less than 250 Households
2. Villages having a bank branch
3. Villages with no bank branch available
Number of villages selected from each strata were based on the proportion of number of villages in each of the 3 categories. Based on the first criteria Cheekatipalle, Parapatla, Dugiperi and Ayyavaripalem villages were selected. Mahal, Pallam and Santhavellore villages were selected based on second criteria and Gundloor, Vikruthamala and Kuvakoli were the villages with no bank branch available. From each village 10 households were randomly selected and the total no. of samples for the study was 100.The information related to the present study was collected through personal interview method. The data collected was pertained to the year 2017-18.
The present study adopted NAFIS (NABARD All India Rural Financial Inclusion Survey 2016-17) framework for measuring the level of financial literacy, which usually connotes a combination of financial knowledge, attitude and behaviour which is necessary for making sound financial decisions. NAFIS frame work was taken as a base to design the scales for measuring the financial knowledge, attitude and behaviour of sample respondents.
The sample respondents were enquired on their basic understanding of risk, return and inflation. The scale for measuring financial knowledge comprises of two statements on which the individual response was elicited. In order to assess the level of individual achievement on the scale of financial knowledge, a combined score was calculated considering the responses to the two statements. For calculating the scores, first each respondent was awarded a score of ‘1’ on a statement if he/she responded to it as ‘true’. The response ‘true’ was considered correct or desirable from the point of view of measuring financial knowledge. Incorrect responses were scored as ‘0’. Thereafter, a combined score was calculated for each individual by summing the score on the two individual statements. The total score that could be achieved by respondents could vary from a minimum of ‘0’ to a maximum of ‘2’. The respondents who scored ‘2’ were rated as high achievers having good financial knowledge.
The present study employed the financial attitude scale used in the NAFIS survey 2016-17, which comprised of three attitude related questions with responses captured on a five point Likert scale. The three scaled attitudinal questions included – ‘I find it more satisfying to spend money than to save it for the long term’, ‘I tend to live for today and let tomorrow take care of itself’, and ‘Money is there to be spent’. The responses were elicited on a five point scale where ‘1’ stood for ‘completely agree’ and ‘5’ meant ‘completely disagree’.
To measure the achievement on financial attitude scale, a combined financial attitude score was calculated. For this, first the scores for each of the respondent on all the three statements were added. Thereafter, the total score was divided by 3 to arrive at the financial attitude score for each individual. The average score could vary from a minimum of 1 to a maximum of 5. All respondents who scored 3 or above were considered to have a positive financial attitude i.e., a saving orientation.
The financial behaviour comprised of a total of 8 questions, which elicit information about various ways in which the respondents manage their money, make financial decisions, keep a tab on their expenses, and timeliness in terms of paying bills etc. They also included questions on whether people set any long term goals, have a household budget and are personally or jointly responsible for it, the way they choose their financial products, and if they have borrowed anything to make ends meet. To understand the overall status of sample respondents with regard to financial behaviour, a combined score of these questions was calculated. The scoring mechanism has been explained in the Table 1. After allocating scores to each respondent on each of the behaviour related questions, the total score on financial behaviour was calculated for the individual respondents.
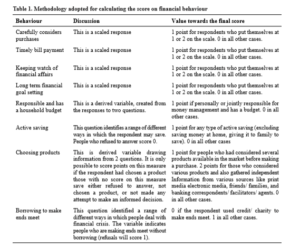
The total score could vary from a minimum of 1 to a maximum of 9. To set a performance benchmark, individuals with a total score of 6 or above were counted as those having a positive financial behaviour.
Financial literacy was a combination of knowledge, attitude and behaviour, and so it makes sense to explore these three components in combination. Therefore, for assessing financial literacy, the scores on financial knowledge, attitude and behaviour worked out in the preceding sections were used to classify each respondent as having ‘good financial literacy’ or otherwise. Any respondent who was assessed ‘having good financial knowledge’ (score of 3); ‘having positive financial attitude’ (score 3 or above’ and ‘having positive financial behaviour’ (score of 6 or above) were classified as having ‘good financial literacy’.
The socio-economic conditions of the farmers revealed that average age of the sample rural respomdents was 47.89 and 37.87 years for agricultural and nonagricultural households respectively and overall majority of the sample respondents were middle aged. 45.24 per cent of the sample respondents from agricultural households were illiterate, primary education (5.95%), high school (34.53%) and intermediate (4.76%) and degree levels (9.52%) respectively. In the case of nonagricultural households, illiterates (18.75%), primary school (12.50%), high school (31.25%), intermediate level (12.50%) and degree level (25.00%). It revealed that in agricultural households, 11.9 per cent of respondents were landless, 21.43 had marginal land holding. While, 46.43, 19.05 and 1.19 per cent of households had small, medium and large land holdings respectively. It was observed that the annual income of the agricultural households was Rs. 194810 and for the non-agricultural households it was Rs. 214950. Overall, the annual income of the sample respondents was Rs. 198033. Average annual consumption expenditure was Rs. 109213.57, Rs. 155637.5 and Rs. 116641.4 for the agricultural, non-agricultural and overall sample respectively.
Financial literacy in context of this study is taken to connote a combination of awareness, knowledge, skill, attitude and behaviour necessary to make sound financial decisions and ultimately achieve individual financial wellbeing.
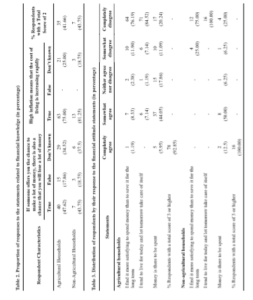
The proportion of respondents found to be knowledgeable about the financial products and services were showed in Table 2. 47.62 per cent of the agricultural households and 43.75 per cent of the non-agricultural households were given true response to the question, if someone offers you the chance to make a lot of money, there is also a chance that you will lose a lot of money. This clearly indicated that these respondents were knowledgeable about the potential risk and returns associated with money.
For the second question “high inflation means that the cost of living is increasing rapidly”. 75.00 per cent and 81.25 per cent of the agricultural and non-agricultural households were given the true responses. This represents that these respondents were aware of the meaning of inflation. The status of respondents with respect to achievement on financial knowledge score as discussed in the methodology presented in Table 2. From the table it was revealed that only 41.66 and 43.75 per cent of the agricultural and nonagricultural households were found to have sound financial knowledge as they got the score of 2.
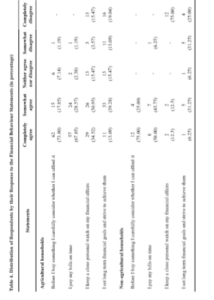
Attitude means a settled way of thinking or feeling about something. Financial attitude can be understood as individuals inclination towards the use of financial resources. The detailed responses received from rural households related to each of the 3 statements used for assessing financial attitude were presented in Table 3. 76.19 per cent and 75.00 per cent of the agricultural and non-agricultural households were put themselves of the completely disagree of the first statement “I find it more satisfying to spend money than to save it for the long time”, and 11.90 and 25.00 per cent of agricultural and non-agricultural households responded somewhat disagree. Only 2.38 per cent of agricultural respondents answered neither agree nor disagree it indicated that they found equal satisfaction in spending money and saving. About 8.33 and 1.19 per cent of agricultural households addressed the somewhat agree and completely agree revealing that they found to be satisfied to spent money than save. None of the non-agricultural households were found under completely agree, somewhat agree and neither agree nor disagree. The responses to the second attitude statement “I tend to live for today and let tomorrow take care of itself”, showed that most of the agricultural households(84.52%) and all the nonagricultural households (100.00%) tended to the take care of tomorrow. Nearly 7.14 per cent of agricultural respondents answered each of the somewhat disagree and somewhat agree and only 1.19 per cent of agricultural households responded neither agree nor disagree. In the case of non-agricultural households no one found under completely agree, somewhat agree, neither agree nor disagree and somewhat disagree.
The third statement related specifically to households attitude towards money. Here a large portion of agricultural households (44.05%) and non-agricultural households (50.00%) were responded somewhat agree to the statement “money is there to be spent”. Around 20.24 per cent and 11.90 per cent of agricultural households and of the non-agricultural households 25.00 and 6.25 per cent were found to be completely disagree and somewhat disagree. Agricultural households (17.86%) and non-agricultural households (6.25%) were ambivalent followed by 5.95 and 12.5 per cent of the agricultural and non-agricultural households were answered completely agree. 92.85 per cent and 100.00 per cent of the agricultural and non-agricultural households were showed that a positive attitude towards planning for the future that was considered to be positively related to financial wellbeing.
The financial behaviour comprised of a total of eight questions, which obtained information about various ways in which the respondents manage their money, make financial decisions, keep a tab on their expenses, and timeliness in terms of paying bills, etc. And also included questions on whether people set any long term goals, had a household budget and the way they choose their financial products. The responses obtained for each of the eight financial behaviour related statements were presented in Tables 4, 5 and 6.
The present study observed that agricultural households (73.80%) and non-agricultural households (75.00%) were carefully consider their purchases before they buy something, while 67.85 and 50.00 per cent of agricultural and non-agricultural households were regularly paid their bills on time and 34.52 per cent of agricultural households and 12.50 per cent of nonagricultural were kept a close watch on their financial affairs and only 13.09 per cent of agricultural households and only 6.25 per cent of non-agricultural households set long term goals and strive to achieve them (Table 4).
Table 5 showed that only 1.19 per cent of agricultural households several products available in the market before making any decision, and none of the non-agricultural households were found under this response. While agricultural (67.85%) and non-agricultural households (62.50%) depended on the advice of friends/family etc., followed by 25.00 per cent of the agricultural households and 37.50 per cent of non-agricultural households were sought opinion of experts/agents dealing with such issues and 5.95 per cent of agricultural households didn’t consider any other product/service other than one they knew about since long. None of the non-agricultural households were found under this response.
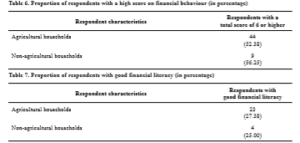
The proportion of respondents that were found to have a positive financial behaviour i.e., score of 6 and above across various categories was presented in Table 6.
The table reveals that 52.38 per cent of agricultural households and 56.25 per cent of the non-agricultural households could score 6 or more on the financial behaviour scale. This indicated that there was a need to be educated about the optimal ways of managing their finances to maintain their overall wellbeing.
The results of the analysis of financial literacy status of respondents have been presented in Table 7. Overall assessment of respondents on financial literacy indicates that only about 44.04 and 56.25 per cent of the agricultural and non-agricultural households could fare in the category of having ‘good financial literacy’. However, on the whole, the current status of financial literacy leaves much to be desired in order to reach an acceptable level, making individuals capable of making sound financial decisions for themselves as well as their households.
The findings of the present study revealed that 41.66 per cent of the agricultural households and 43.75 per cent of the non-agricultural households were having sound financial knowledge. When assessed for financial attitude, 92.85 per cent individuals from agricultural households and 100.00 per cent from non-agricultural households had positive attitude, earning score of 3 or more on a sale of 5. Behavioural assessment reflected that agricultural households (52.38%) and non-agricultural households (56.25%) exhibited good financial behaviour, earning score of 6 or more on a scale of 5. As per the combined estimation on financial literacy status, for individuals who fared well in all three components, only 27.38 per cent of agricultural households and about 25.00 per cent nonagricultural households were found to have good financial literacy. The study revealed that financial literacy status of the rural households in Chittoor district was poor. Hence there is a need for taking up various financial literacy programmes in rural areas, so that the upliftment of rural population can be possible.
Garg, S and Agarwal, P. 2014. Financial inclusion in India – A review of initiatives and achievements. Journal of Business and Management. 16(6): 52-61.
Sharma, N and Singh, V. 2016. Awareness of households towards financial services: A step towards inclusive financing. International Journal of Advance Research in Computer Science and Management Studies. 4(6): 370-379.
NABARD (National Bank for Agriculture and Rural Development). 2018. All India rural financial inclusion survey 2016-17.