
0 Views
Department of Entomology, S.V. Agricultural College, ANGRAU, Tirupati-517 502.
The details on the correlation between various weather parameters and the occurrence of major sucking pests like thrips
in Groundnut will be extremely useful in developing better Integrated Pest Management (IPM) methods, as weather parameters determine the pest’s population build up and severity. Field experiment conducted to study the incidence of thrips in Groundnut during rabi,2021-22 revealed that thrips population and damage on the crop commenced from 15 DAS and continued up to the end of the crop period. Thrips population reached peak during 6th SW of 2022 at 64 DAS with 6.44 thrips/plant. The infestation level reached to peak level from 64 DAS (97.05%) and there after became 100% by the end of crop period. However, the highest number of thrips (6/plant) was recorded during 64 to 78 DAS (i.e., 6,7 and 8 SW’S, February 2022). Correlation of weather parameters viz.,Maximum and Minimum Temperatures, Morning and Evening Relative Humidity, Rainfall and Sunshine hours with the incidence of Thrips revealed that thrips showed non-significant positive correlation with Max., Min. Temperatures, Morning Relative Humidity and sunshine hours and Negative correlation with Evening RH and Rainfall.
KEYWORDS: Thrips, Standard Week (SW), Weather Parameters, Correlation.
Groundnut, Arachis hypogea L., is a tetra foliate legume with yellow sessile flowers and subterranean pods which belongs to the family Fabaceae. The word Arachis hypogea was derived from two Greek words, Arachis which means ‘legume’ and hypogea means ‘below ground’. South America is considered to be the primary centres of origin for groundnut because of the presence of diversity of wild species in that continent. It is also known as peanut, monkey nut, earth nut etc. It is the fourth principal source of edible oil and the third largest source of vegetable protein grown in tropical and subtropical countries. India is one of the world’s largest exporters and trades closely with Brazil, the US and China with a 20-25% stake in global markets. (IOPEPC kharif – 2017).
Groundnut is described as the “King of oil seeds” because of its high oil content (43-45%) and protein (25-28%) and also a valuable source of vitamins viz., B, E and K. Groundnut cake after oil extraction is a high protein animal feed and haulm provides quality fodder. The edible oil is used for cooking. It is commonly used in preparation of medicines and high-quality soaps.
India is one of the leading countries in the cultivation of groundnut, grown in 4. 82 million hectares, with a production of 9.95 million tonnes and an average productivity of 2063 kg/ha. (www.indiastat.com, Ministry of Agriculture and Farmers welfare, Government of India, 2020). In Andhra Pradesh, groundnut occupies an area of 0.66 million hectares with a total production of 0.848 million tonnes and productivity of 1284 kg/ ha (www.indiastat.com). Amongst different districts of Andhra Pradesh, in Chittoor, groundnut is grown in an area of 1.08 lakh hectares, with a total production of 2.04 lakh tonnes and productivity of 1732 kg ha-1 (kharif) and 3050 kg ha-1 (rabi) (Directorate of Economics and Statistics, 2020). Despite of its high production potential, the actual yield in the farmer’s field is quite low, largely because of major rainfed cultivation, and the crop may be harmed by either mid-season or late season drought and also due to insects and diseases.
Groundnut crop is attacked by about 100 species of insect pests (Baskaran and Rajavel, 2013). A total of 13 species of sucking insect pests were found feeding and damaging the groundnut crop (Kandakoor et al., 2012). The major sucking pests of groundnut includes thrips viz., Scirtothrips dorsalis Hood, Frankliniella schultzei
Trybom, Thrips palmi Karny, Caliothrips indicus Bannall and leafhopper, Empoasca kerri Pruthi and aphid, Aphis craccivora Koch, apart from few other minor sucking pests (Gocher and Ahmed., 2019).
Thrips mainly feed by lacerating and sucking the sap from leaves. Thrips live in young foliage especially between the folded groundnut leaflets and flowers that inhibit terminal buds and flowers. Both nymphs and adults feed by rasping the surface of rapidly growing leaf tissues and suck the released plant fluid. They cause tiny scars on leaves leading to stunted plant growth. Damaged leaves may become papery and distorted, infested terminal leaves lose colour, rolled up and drop before maturity (Chisholm and Lewis, 1984). Apart from the direct damage by thrips, they play a significant role in transmission of viral diseases. Thrips act as vectors for bud necrosis/stem necrosis disease caused by tomato spotted wilt virus and the disease has affected 2,25,000 hectares in Anantapur district during kharif, 2000 causing a monitory loss of 3 billion rupees (Rao et al., 2003).
In recent seasons, these thrips have been noticed as menace to groundnut crop by attaining major pest status creating the necessity of attentive management than defoliators. The details on the correlation between various weather parameters and the occurrence of major sucking pests like thrips and leafhoppers will be extremely useful in developing better Integrated Pest Management (IPM) methods, as weather parameters determine the pest’s population build up and severity. Hence, by considering the economic importance of thrips in groundnut, the present effect of weather parameters on incidence of thrips was carried out during rabi 2021-22.
The experiment was laid out in a plot size of 10 m x 10 m. The experiment was conducted with Dharani, a local popular variety of groundnut. Sowing of crop was carried out with a seed rate of 80 kg/ha with a spacing of 22.5 x 10 cm during rabi season at Dry land farm (l3o37’35’’ N, 79o 21’52’’ E), S.V. Agricultural College, Tirupati.
At 15 DAS, five 1 m2 areas were earmarked with pegs and each m2 was labeled as 1, 2, 3, 4 and 5. From each m2 area, the data on thrips and leafhoppers incidence and their population was recorded at weekly intervals starting from 15 days after sowing up to 106 days after sowing (Harvesting). Field observations were made as suggested by Kandakoor et al., 2012.
Studying the incidence of thrips (S. dorsalis, M. usitatus,schultzei and T. palmi)
Foliar damage in each m2 area was observed every time from 5 randomly selected tagged plants. Total no. of leaves were counted and multiplied with 4 and noted down as total no. of leaflets. Then from each plant, total no. of leaflets damaged by thrips were counted and recorded. Per cent leaves damaged by thrips was calculated by using the mean data obtained from 5 m2 areas. The symptoms like fresh and old scratches on leaflets, mottling of leaflets, white pale spots on leaflets, elongation of leaflets due to all the rasping symptoms were considered for recording the leaf damage by thrips. Per cent leaf infestation data was subjected to angular transformation and statistical analysis (One way Repeated measures ANOVA) was carried using SPSS software
In each earmarked plant top growing portion was bent onto a clean A4 white paper and tapped gently. Tapping was carried out gently 4 to 5 times up to the time that almost all the thrips were fallen on to the paper from test plant. Terminal growing point was selected for counting, because it was observed that most of the thrips were preferring to feed on the tender parts where the leaves are highly succulent. No. of thrips fallen on to the paper were counted and noted down and the procedure was continued for all the tagged plants. Mean no. of thrips was calculated and subjected to square root transformation and statistical analysis was carried out using SPSS software.
The weather parameters viz., maximum temperature (oC), minimum temperature (oC), rainfall (mm), relative humidity (%) and sunshine (hrs) were recorded at meteorological observatory, RARS, Tirupati. The mean weather data per 7 days (one week) was calculated from the recorded data. Correlation studies were carried out to know the impact of temperature, rainfall and relative humidity on the incidence of thrips.
During rabi 2021-22, field incidence of thrips in terms of foliar damage and population was recorded from 52nd standard week of 2021 to 12th standard week of 2022. The data indicated that the thrips damage was first noticed in 52nd SW of 2021 (15 DAS, I FN of December).
During 52nd SW of 2021(I FN of December), the intensity of damage was increased to 23.88 and the symptoms like rasping symptoms were observed on leaflets. The population was 1.84 thrips per plant (Table 1, 2).
Thrips belongs to the order Thysanoptera, having the rasping and sucking type of mouthparts (Asymmetrical type). They feed on leaf tissue by puncturing the epidermal (outer) layer of the host tissue and sucks the contents out of the cell which results in the discoloured flecking, silvering, scratches on leaves and elongation of leaves. The damage symptoms on leaflets were taken into consideration for recording the of percent foliar damage done by thrips.
The following symptoms were observed from the tender unopened and mature leaflets during the crop growth period.


Symptoms of damage by thrips was observed at 15 Days After Sowing. At 15 DAS i.e., during the 51st Standard week of 2021(I FN of December), 14.9 percent of leaflets were damaged by thrips and the population of thrips recorded was 1.32 per plant. Symptoms like white minute spots and fresh scratches on leaflets were noticed during the period of data record. At 29 DAS, during the 1st Standard week of 2022 (29 DAS, I FN of January), the percentage of foliar damage was raised from 23.88 t 40.5 percent and the population also increased from 1.84 to 2.96 thrips per plant. Same symptoms which were observed during the previous weeks was observed. In 2nd Standard week (36 DAS, I FN of January), 51.93 per cent damage was recorded and the population increased from 2.96 to 3.36 thrips per plant (Table 1, 2). Symptoms of damage observed during this period were fresh scratches in unopened leaflets and old scratches on matured leaflets along with narrowing of leaflets.
During the 3rd SW (43 DAS, II FN of January), damage recorded was 72.24 per cent and the thrips count recorded was increased from 3.36 to 3.56 per plant. This period has recorded the thrips population not only on the leaflets but also the rasping and scratchings were observed from flowers. Symptoms like narrowing, mottling and elongation of leaflets were observed during this period. A significant increase in damage was recorded from 4th SW (50 DAS, II FN of January) i.e., from 72.24 to 82.12 percent when the thrips population was 3.72 per plant. Same symptoms which were observed during the 3rd SW were noticed (Table 1, 2).
A slight increase in damage percentage was observed during the 5th standard week i.e., from 82.12 to 83.77. The thrips count also increased from 3.72 to 4.16 per plant. At 64 DAS, i.e., 6th standard week of 2022 (I FN of February) almost all the leaflets were damaged by thrips. A highest damage percentage of 97.05 and the highest number of thrip count of 6.44 per plant was also recorded during this period.
From 7th SW (71 DAS, I FN of February, 2022) to 10th SW (92 DAS, I FN of March, 2022) the damage percentage varied from 98.56 to 98.96 and the thrip count shown a decline in population. The per cent foliar damage recorded from 7th, 8th, 9th and 10th was 98.56, 98.11, 98.19 and 98.96 per cent respectively and the population count recorded from these weeks was 5.88, 5.68, 4.6 and 4.44 respectively. By the last weeks of crop period i.e., 11th (99 DAS, I FN of March, 2022) and 12th SW’s (106 DAS, II FN of March, 2022), the damage was still increased. The percent damage and thrips population noticed at 11th and 12th SW’s was 99.79, 99.85 and 3.28, 3.68 respectively. All the symptoms such as old brown scratches on leaflets due to rasping and sucking by thrips, narrowing, elongation, mottling and cupping of leaflets were observed during the end of crop period (Table 1, 2).
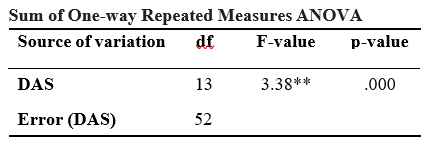
From the Table 1 and 2, it is clearly evidenced that there is significant difference in incidence of thrips both in terms of foliar damage and population (F-value significant, p-value<0.05) between different standard weeks within the crop period.
Correlation with weather parameters revealed that Thrips population showed non-significant positive correlation with Max temp. (r=0.261), Min Temp. (r=0.032), Sunshine hours (r=0.497) and morning relative humidity (r=0.131), whereas evening relative humidity (r=-0.336) and rainfall (r=-0.279) showed non-significant negative correlation. Foliar damage percentage done by thrips correlated with weather parameters showed significant positive correlation with Max temp. (r=0.99) and non-significant positive correlation with Min Temp. (r=0257) and Sunshine hours (r=0.375) whereas morning relative humidity (r=-0.360), evening relative humidity showed significant negative correlation (r=-0.654) and rainfall (r=-0.254) showed non-significant negative correlation.
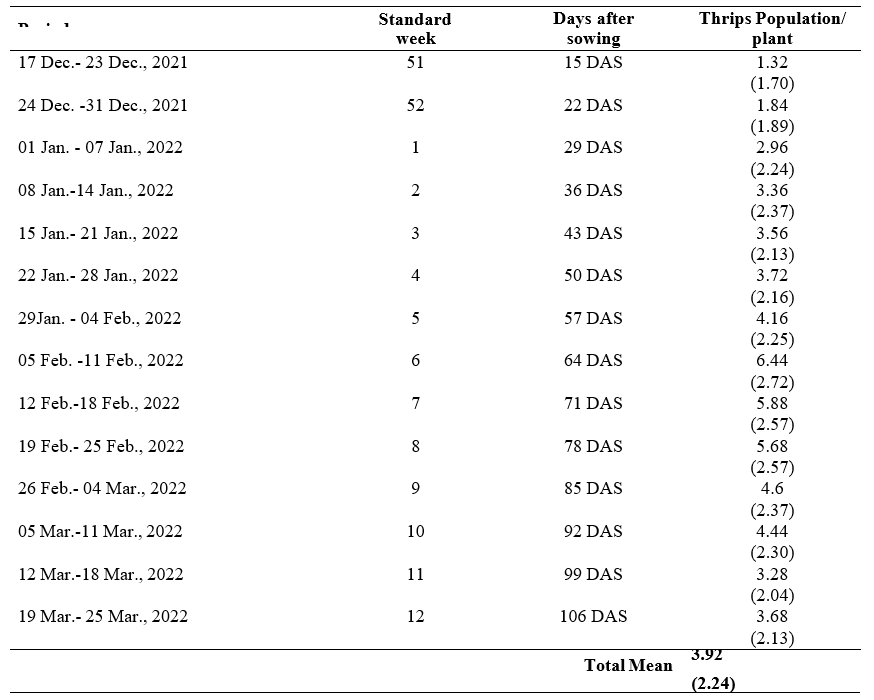
The values are means of five replications; Figures in parenthesis are angular transformed values.
The results are in agreement with Naresh et al. (2018) who reported the peak incidence of thrips on groundnut was observed from 52nd SW of 2015 to 17th SW of 2016. Saritha et al. (2020) reported that thrips attained peak in the 31st SMW and decreased till the 38th SMW. Kumbar et al. (2021), where the incidence of thrips were noticed from vegetative stage to the end of crop period with peak incidence during post flowering to pod formation stage.
The results of present investigation are in line with Naresh et al. (2018) noticed that thrip population has shown positive correlation with maximum temperature and negative association with other weather factors like relative humidity which were in accordance with present results. Kumbhar et al. (2021) reported the positive influence of maximum and minimum temperatures on the thrips infestation was in conformity with the present findings. Similarly, Vijayalakshmi et al. (2017) also reported that population of thrips has shown
nonsignificant positive correlation with minimum temperature and nonsignificant negative correlation with relative humidity. Kandakoor et al. (2012) noticed that thrips showed nonsignificant positive correlation with minimum temperature and sunshine hours and negative correlation with rainfall in groundnut crop.
Baskaran, R.K and Rajavel, D.S. 2013. Yield loss by major insect pests in groundnut. Annals of Plant Protection Sciences. 21(1): 189-190.
Chisholm, I.F and Lewis, T. 1984. A new look at thrips (Thysanoptera) mouthparts, their action and effects of feeding on plant tissue. Bulletin of Entomological Research. 74: 663-675
Directorate of Economics and Statistics. 2020. https:// des.ap.gov.in/
Gocher, S and Ahmad, S. 2019. Seasonal incidence of major sucking insect pests of groundnut in relation to weather parameters of semi-arid region of India. International Journal of Current Microbiology and Applied sciences. 8 (8): 1106-1111.
IOPEPC Kharif-2017. Survey of groundnut crop. Indian oilseeds and produce export promotion council, Mumbai. 2017. http://www.iopepc.org/ Groundnut%20Survey%20Report-Kharif%20 2017.pdf.
Kandakoor, B., Khan, K.H., Gowda, B.G., Chakravarthy, A.K., Kumar, C.T.A and Venkataravana, P. The incidence and abundance of sucking insect pests on groundnut. 2012. Current Biotica. 6(3): 342-348
Kumbhar, N.B., Mutkule, D.S., Fand, D.N., Gore, S.H., Ghodke, S.S and Biradar, J.M. 2021. Studies on the population dynamics of different insect pest of groundnut. The Pharma Innovation Journal. 10(12): 1958-1964.
Naresh, T., Rao, A.R., Krishna, T.M., Devaki, K., Ahammed, S.K and Sumathi, P. 2018. Seasonal incidence and effect of abiotic factors on population dynamics of thrips on groundnut (Arachis hypogaea L.) during rabi season. Journal of Pharmacognosy and Physochemistry. 7(2): 1600-1604.
Rao, R.D.V.J.P., Reddy, D.V.R., Nigam, S.N., Reddy, A.S., Waliyar, F., Reddy, T.Y., Subramanyam, K., Sudheer, N.J., Naik, K.S.S., Bandyopadhyay, A., Desai, S., Ghewande, M.P., Basu, M.S and Somasekhar. 2003. Peanut Stem Necrosis: A New Disease of Groundnut in India. Information Bulletin No. 67. Technical Report. International Crops Research Institute for the Semi-Arid Tropics, Patancheru, Telangana, India.
Saritha, R., Sirisha, A.B.M., Haseena, S.K and Sujatha, 2020. Impact of weather on incidence of sucking pests in groundnut. Journal of Entomology and Zoology Studies. 8(3): 1157-1163.
Vijayalakshmi, G., Ganapathy, N and Kennedy, J.S. 2017. Influence of weather parameters on seasonal incidence of thrips and Groundnut bud necrosis virus (GBNV) in groundnut (Arachis hypogea L.). Journal of Entomology and Zoology. 5 (3): 107-110.
www.indiastat.com, Ministry of Agriculture and Farmers Welfare, Government of India, 2020.