
0 Views
M.DEVAKRUPA1, Y.PRABHAVATHI2, I. BHAVANI DEVI3 AND P. LAVANYA KUMARI4
Institute of Agribusiness Management, S.V. Agricultural College, Tirupati – 517502
The analyses the consumption pattern of PDS supplies in rural and urban aras of Rayalaseema region. The share of PDS supplies in meeting the consumption needs of both rural and urban households was less compared to the open market. The study revealed that though the PDS was digitilised still some problems such as adulteration of PDS supplies, weighting procedure followed by dealers, quality of supplies, black marketing, non-availability of supplies were observed in some parts of the study area.
KEYWORDS:Public Distribution System (PDS), diversions, adulteratios.
India is world’s second most densely populated
nation, which is habitat for 17.74 per cent of the total world population i.e 1.35 billion (2018). Further it is estimated that India need to feed 1.7 billions of population by 2050 and feeding the population is the future major challenge the country need to face. The country has witnessed record production of 277.49 million tonnes food grains in 2017-2018, in which rice accounted for 111.01 million tonnes and wheat accounted for 97.11 million tonnes. Though there was record production in the food grains still there were large no of people who avails one meal a day. In India 38 per cent of the children under the age of 5 years were affected by stunting and 51 per cent of Indian women of reproductive age were suffering from anaemia and chronic huger. (Global Nutrition Report, 2017). In 2017 rank of India in Global Hunger Index was 100 among the 119 nations. These alarming figures showed that there is food accessibility problem despite of the availability of food grains
In India most of the households were under below poverty line and don’t have physical and economical access to food. Hence they were unable to meet their daily calorie consumption needs and unable to maintain the nutritional standards. One measure to address the challenge of food security is through Public Distribution system (PDS). PDS is the largest network in the world,aimed to supply food grains to the households at subsidized prices. The National Food Security Act, 2013 also focuses on providing food security via expansion of the PDS. NFSA seeks to make the right to food a legal entitlement by providing subsidized food grains to almost two-thirds of the population. Several reforms were introduced for streamlining the functioning of PDS in India and several states have also come up with several reforms .Govt of Andhra Pradesh state introduced point of sale machines and eradicated ghost cards to minimize leakages and improve efficiency
The present study is aimed to understand the ac- tual PDS purchases and open market purchases by the rural and urban households and relating them with expen- diture incurred for spending on the total purchases so as to provide insights on efficiency of Public distribution sys- tem Though Indian economy has experienced tremendous economic growth and decline in poverty over the past two decades improvements in nutritional status have not kept pace with this economic growth (NITI Aayog Re- port, 2016). The per capita daily calorie consumption in rural Andhra Pradesh was found to be 2,365 kcal, and for urban Andhra Pradesh it was a little lower, at 2,281 kcal. These numbers are lower than the Indian Council of Medical Research (ICMR) standard requirement of 2,400 kcal per day. (NSS Report, 2011-12). The improvement in nutritional status can be seen only when adequate and nutritious food is consumed by the all sections of people.
The study was undertaken in the Rayalseema region (comprising of four districts) of Andhra Pradesh State. The sampling technique employed was purposive cum multi stage random sampling technique.For selection of urban households, from each district headquarters of Rayalseema region, the list of fair price shop (FPS) dealers were obtained and two dealers from each district were selected randomly. The list of households were obtained from identified FPS dealer and randomly fifteen households were selected from each identified FPS dealer. Thus the total sample size of urban households were 120. For selection of rural households, two mandals from each district were randomly chosen. From selected mandals , one village from each mandal was chosen randomly and one FPS dealer was selected randomly from the village identified.. The household list was obtained from FPS dealer identified and 15 households were randomly chosen from each FPS dealer identified. Thus the rural households sample size was 120. Thus the total sample size for the study was 240. The information related to the present study was collected from rural and urban sample households using a well defined and pre-tested schedule through personal interview method. The data collected was analyzed statistically using SPSS program. to arrive at valid conclusions. The tools used for the study were percentage analysis and Independent sample t-test.
Data collected is interpreted in terms of their frequencies and percentages wherever necessary to know the purchasing pattern of respondents according to variables.
The independent Sample t – Test compares the means of two independent groups in order to determine whether there is statistical evidence that the associated population means are significantly different.
RESULTS AND DISCUSSIONS:
FAMILY SIZE PARTICULARS OF SAMPLE HOUSEHOLDS
TABLE 1. FAMILY SIZE PARTICULARS OF SAMPLE HOUSEHOLDS
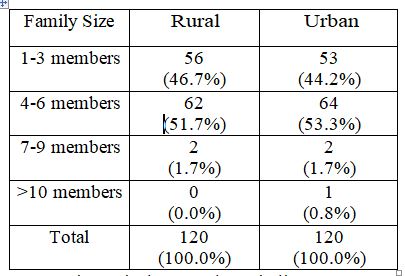
Note: Figures in the parentheses indicate percentage to total
A perusal of Table 1 shows that out of the total 240 households, rural households were 120 and urban households were 120. Majorly 51.7 per cent of rural households and 53.3 per cent of urban households belonged to the category of 4-6 members. The average rural and urban family household size was 3.6 and 3.5 respectively.
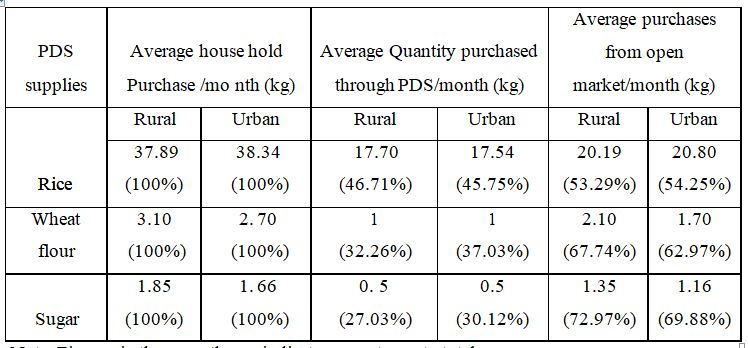
Note: Figures in the parentheses indicate percentages to total
Table 2 infers that in rural areas the average household purchase of rice per month was 37.89 kgs, of which 17.70 kgs (46.71%) was purchased through PDS and 20.19 kgs (53.29%) was from open market. The average household purchase of wheat flour was 3.10kgs per month of which was 1kg (32.26%) 2.10kgs (67.74%) per month were purchased from PDS and open market respectively. The average household purchase of sugar per month was 1.85 kgs of which sugar purchases from PDS was 0.5 kgs per month (27.03%) and the purchases from open market was about 1.35kgs per month (72.97%)
In urban areas the average household purchase of rice per month was 38.34 kgs. Of which 17.54 kgs (45.75%) was purchased through PDS and 20.80 kg (54.25%) was from open market. The average household purchase of wheat flour was 2.70 kgs per month, of which purchases through PDS was 1kg per month (37.03%) and from open market was 1.70kgs (62.97%). The average household purchase of sugar per month was 1.66 kgs of which purchases from PDS was 0.5 kgs per month (30.12%) and the from open market was 1.16 kgs per month (69.88%).
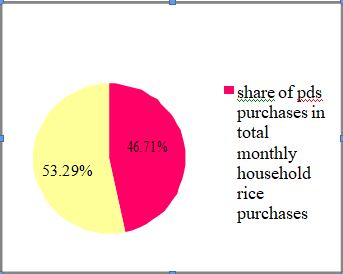
Fig: 1 indicates that in rural areas 46.71 per cent of the house hold monthly purchases of rice were made through PDS, while purchases from open market per month constituted around 53.29 per cent.
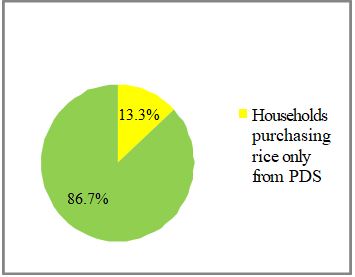
Fig: 2 indicates that 13.3 percent of the rural house holds were purely dependent on PDS for purchasing rice and 86.7 per cent of rural households were purchasing rice from both PDS .and open maret.
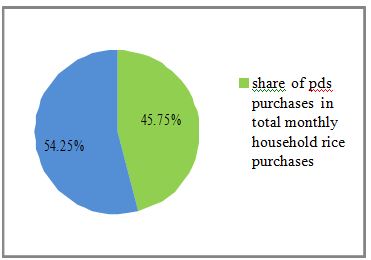
Fig: 3 indicates that in urban areas 45.75 per cent of the house hold monthly purchases of rice were made through PDS while monthly purchases from open market per month constituted around
Fig : 4 Purchasing pattern of rice in urban households from various sources
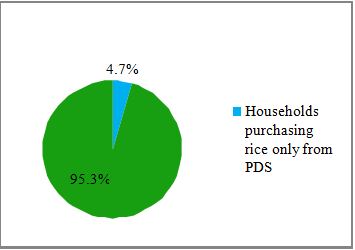
Fig: 4 indicates that 4.7 per cent of the urban households were purely dependent on PDS for purchasing rice and 95.3 per cent of the rural households were depending on both PDS and.open market.
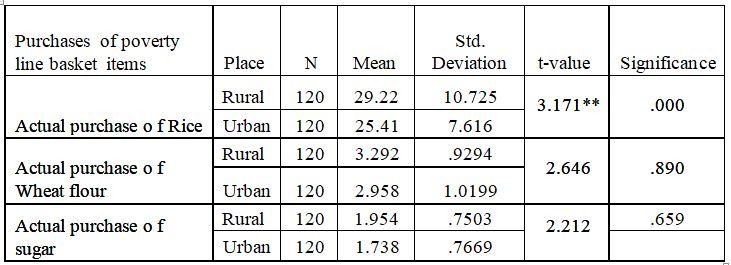
Note: ** 1% level of sig nificance
Independent sample t-test was carried out to test the sig- nificant difference between the rural and urban house- holds with respect to actual purchases of poverty line basket items. Table 3 inferred that there was significant difference in the actual purchases of rice between rural and urban households at 1% level of significance (p<0.01). Further it can be observed that rural households had high actual purchases (29.22 kg/ month) compared to urban households i.e (25.42 kg/ month). The reasons could be difference in the family size of the households. No significant difference was observed in case of actual wheat flour and sugar purchases between the rural and urban households.
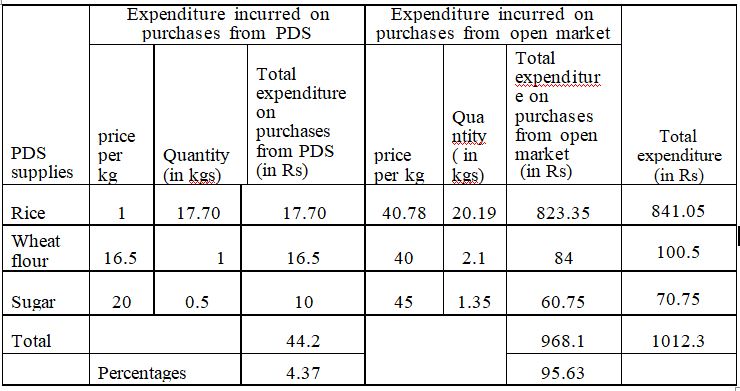
A perusal of Table 4 shows that in rural areas the household’s total expenditure per month was Rs 1012.3 of which Rs 44.20 (4.37 percent) was incurred on PDS purchases and open market purchases accounted for Rs 968.10 (95.63 per cent).
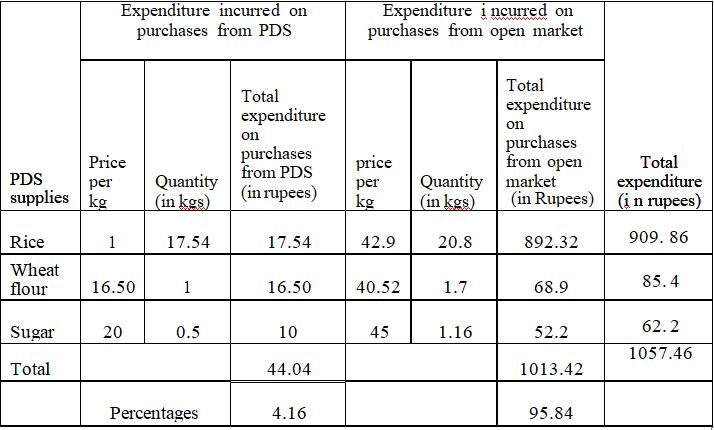
A perusal of Table 6 shows that in urban areas the household’s total expenditure per month was Rs 1057.46 of which Rs 44.04 (4.16 percent) was spent on PDS sup- plies and Rs 1013.42 (95.84 per cent) was spent on open market purchases.
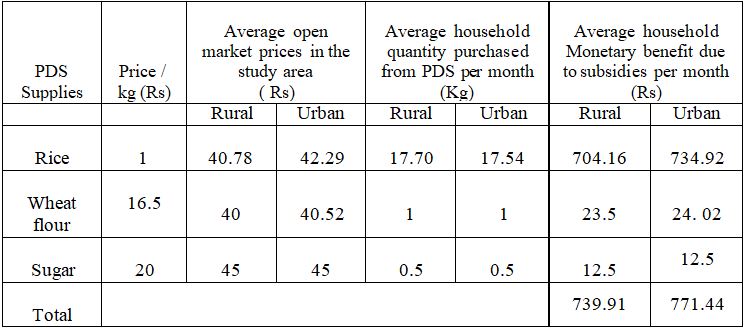
It is inferred from Table 6 that in rural areas the
open market per kg prices for rice , wheat flour and sugar were Rs 42.29, Rs 40.52 and Rs 45 per kg while in urban areas the prices were Rs 42.29, Rs 40.52 and Rs 45 respectively. The average household quantity of poverty line basket items that were purchased monthly from PDS by rural and urban households accounted for rice were
17.70 Kgs and 17.54 kgs respectively while wheat flour and sugar accounted for 1kg and 0.5 kg respectively by both rural and urban households. The monthly monetary benefit that the rural and urban households were getting due to subsidies for rice were Rs 704.16 and Rs 734.92 respectively, for wheat flour it was Rs 23.5 and Rs 24.02 respectively and for sugar it was Rs 12.5 and Rs 12.5 respectively. The total monthly monetary benefit from PDS purchases by rural and urban households were Rs 739.91and Rs 771.44.
The major findings of the study include the major PDS supplies in the rayalaseema region of Andhra Pradesh State were rice, wheat flour and sugar. The average household purchases of rice per month by rural and urban households accounted for 37.89 Kgs and 38.34 Kgs respectively. 46.71 per cent and 45.75 per cent of the total monthly rice purchases were made through PDS and the remaining 53.29 per cent and 54.25 per cent were made from open market purchases in both rural and urban areas respectively. But there was significant difference in the actual purchases of rice between rural and urban households at 1% level of significance i.e rural households had high actual purchases (29.22kg/ month) compared to urban households i.e (25.42 kg/ month). The total expenditure incurred by rural and urban households for purchasing PDS supplies amounted to Rs 1012.3 and Rs 1057.46 i n rural and urban areas respecti vel y. The monetary benefit availed from PDS purchases by rural and urban households amounted to Rs 739.91and Rs
771.44. Themajority of householdsin rural and urban areas are availi ng monetary benefit but only 13.3 per cent of therural householdsand 4.7 per cent of urban households werepurely dependent on PDSfor purchasing ricewhich indicates the real ne d of these households. While the remaining percentageof householdsthough availing PDS supplies are either consuming very little or diverting for other purposes leading to inefficiency of PDS.