
0 Views
Department of Statistics and Computer Applications, ANGRAU-S.V. Agricultural College,Tirupati-517 502.
Rice (Oryza sativa, f: Gramineae) is an important food crop among the cereals that is majorly affected by insect pests. More than 70 insect species are associated with the rice crop at one stage or the other, and 20 are pests of major economic significance. Among the sucking pests, Yellow Stem Borer (YSB) and Rice Leaf Folder (RLF) cause a severe threat to rice production. There is a need to understand the similarity of pest patterns among various locations in Andhra Pradesh before fixing the type of forewarning advisory, either at the district level or location-specific. In this context, Primary data on major insect catches in rice were collected from solar light traps installed at Farmer’s open Rice fields under the Sree PVF Project running from S.V. Agricultural College, ANGRAU, Tirupati in Eight districts of Andhra Pradesh during and Kharif seasons. The pest patterns were compared using Pettit’s test and Buishand Range test for two major pests of Rice in eight districts viz., Nandyala, SPS Nellore, Anantapur, Annamayya, Chittoor, YSR Kadapa, Krishna and East Godavari. The study concludes that effective management of pest patterns is crucial for sustainable rice production and explores essential information for location- specific pest management strategies.
KEYWORDS: Solar light traps, insect catches in rice, pest pattern and non-parametric approach.
Rice (Oryza sativa L.) is the most important cereal crop and symbol of both cultural identity and global unity. The year 2004 was declared the International Year of Rice because rice is the staple food for more than half of the world’s population. A sustainable increase in rice production will reduce hunger and poverty and contribute to environmental conservation and a better life for present and future generations for whom Rice is Life. Of the more than 70 species recorded as pests of rice, about 20 have major significance. However, in commercial production, rice productivity and quality are adversely affected by many biotic stresses, particularly insect pests. Insect pests damage the rice crop at different stages of its growth. Yield losses in global rice output due to pests (diseases, animal pests, and weeds), range from up to 20 per cent to at least 30 per cent of the attainable yield (Savary, et al., 2000). Out of these, oAnly a few are potential threats. Yellow Stem Borer (YSB), Brown Plant Hopper (BPH), Rice Leaf Folder (RLF), Gall Midge (GM), etc., cause damage to rice fields. This study is taken up to compare the major pest patterns in rice among several districts of Andhra Pradesh to know the need for location-specific advisory for effective pest management.
Solar light traps were installed at Nandyala, SPS Nellore, Anantapur, Annamayya, Chittoor, YSR Kadapa, Krishna and East Godavari districts of Andhra Pradesh under an externally funded project sponsored by Sree Padmavathi Venkateswara Foundation, Vijayawada which is being run from S.V. Agricultural College, ANGRAU, Tirupati. Insect count data on major pests in rice viz.., Yellow Stemborer (YSB) and Rice Leaf Folder (RLF) on a daily basis for Rabi and Kharif seasons for the year 2022-23 was collected from farmers’ rice fields.
Descriptive or summary statistics play a vital role in data analysis and it is used to summarize, describe and present data in a meaningful and interpretable manner.
This statistical test is a non-parametric rank test, widely used for evaluating the presence of abrupt changes in the time series of the climatic data, given by Pettit (1979). This test application can be found in Buragohain, et al., 2023 and Dubey, et al., 2023. This test can identify the significant change in the mean of a time series when
the exact time of the shift is not known. In this test, the ranks r1, r2, r3, … rn, of the series Y1, Y2, Y3, … Yn, is used for the calculation of the statistics (Zarenistanak et al. 2014):
Xk = 2∑𝑟𝑖 − 𝑘(𝑛 + 1)𝑘 = 1 … … … 𝑛—————— (1)
XE = max |Xk| for 1≤k≤n——————- (2)
Kumar, T et.al., 2022 utilised this test for Trend Analysis of Groundwater Level, Rainfall and Area under Groundwater Irrigation in Ropar district of Punjab
Buishand range test
Buishand (1982) developed this statistical test. The application of this test can be found in Polisetty, et al., 2023, Yildirim, G and Rahman, A 2022. Rabab, et.al., 2024 utilised both Pettit’s test and Buishand test for rainfall trend detection. In this test the adjusted partial sum, which is the cumulative deviation from the mean for kth observation of series x1, x2, x3, …, xn with a mean (�𝑥) can be calculated as,
S∗ = 0 and S∗ = ∑k (Yi − Y) k = 1,2, … … , n (3)
The statistical significance test of the realized shift is tested with the “rescaled adjusted range (R)”, the difference between the maximum and minimum of 𝑆∗K values scaled by sample standard deviation:
![]()
Both Pettit’s and Buishand’s range test can be observed in Oganja, Y.H, et.al., 2024 and Mohammadi, H, et.al., 2024.
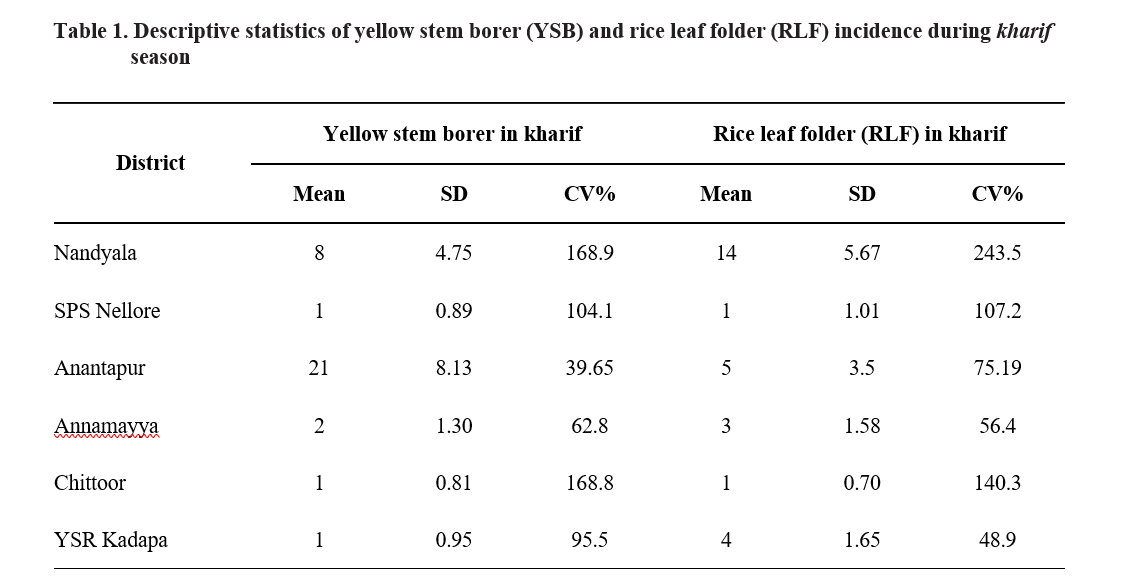
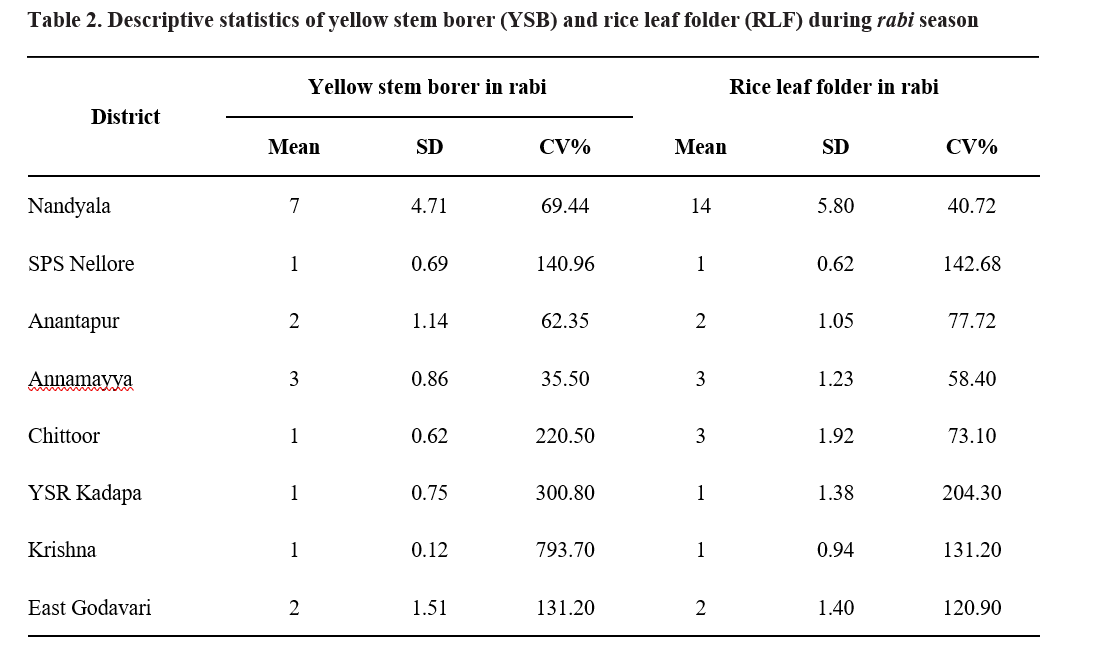
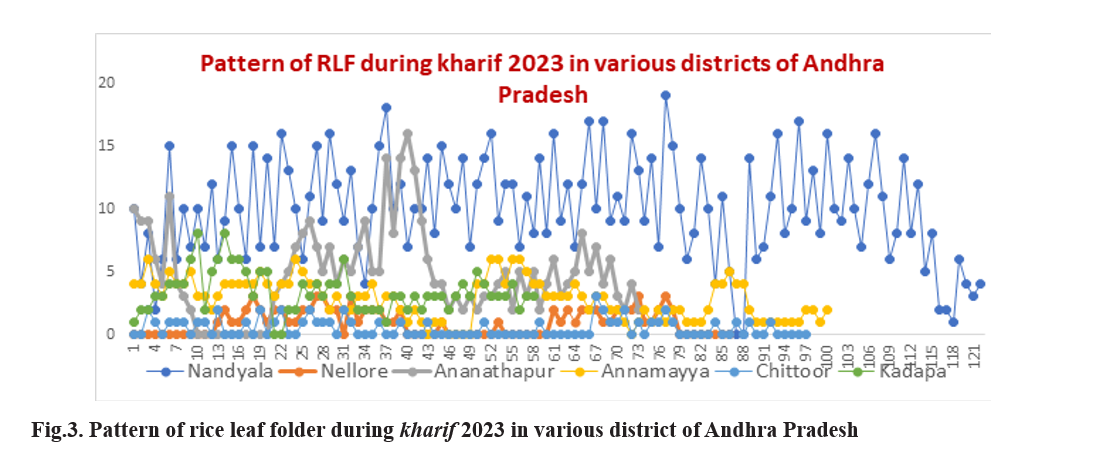
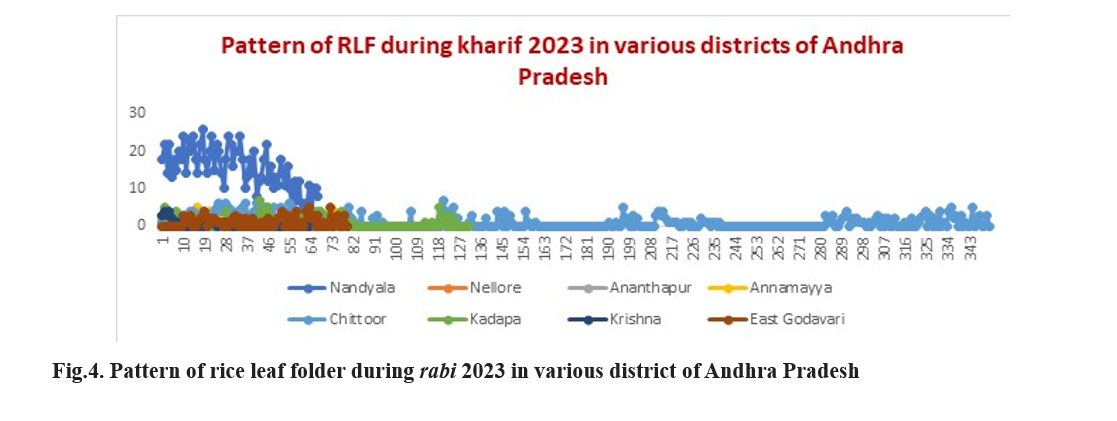
Tables 1 and 2 present the mean, standard deviation and coefficient of variance (CV%) computed for the insect pest counts of Yellow Stem Borer and Rice Leaf Folder in six districts during Kharif and in eight districts during Rabi, in Andhra Pradesh. During Kharif, the CV% ranged between 39.65 per cent to 168.9 per cent for YSB and for RLF was between 48.9 per cent to 243.5 per cent indicating high level inconsistency. Whereas during Rabi, the CV% of YSB ranged between 35.5 per cent to 793.7 per cent, and RLF ranged between 40.72 per cent to 204.3 per cent indicating that the data under consideration is highly heterogeneous among various districts.
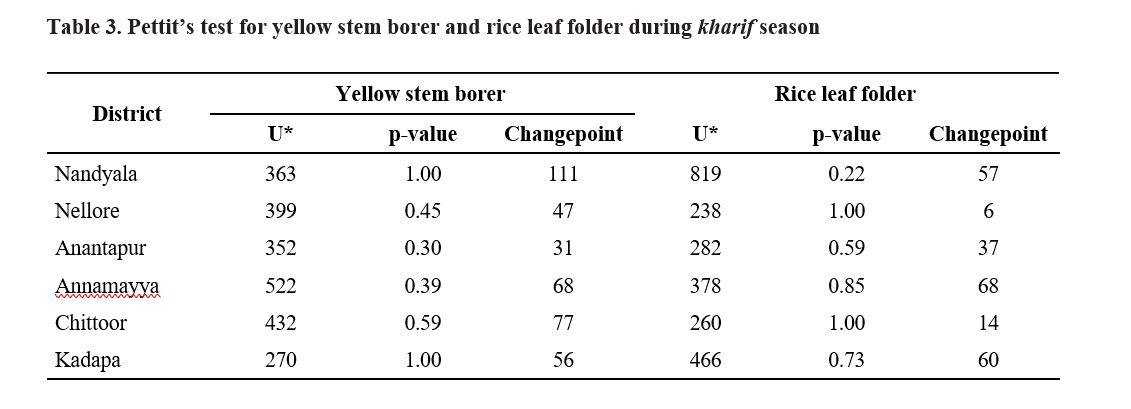
Pettitt’s test is a non-parametric statistical test used to detect a single change point or shift in a time series. This test can be observed in Hurtado, et.al., 2020 and Laasya, et.al., 2024. The test statistic (U*) measures the magnitude of the change detected in the time series based on the ranks of observations before and after the potential change points. A significant p-value indicates the presence of a change point or shift at time (K) in the time series data.
From Table-3, it is noticed that, during Kharif season, there was no change in the pattern of the Yellow Stem Borer and Rice Leaf Folder among all districts.
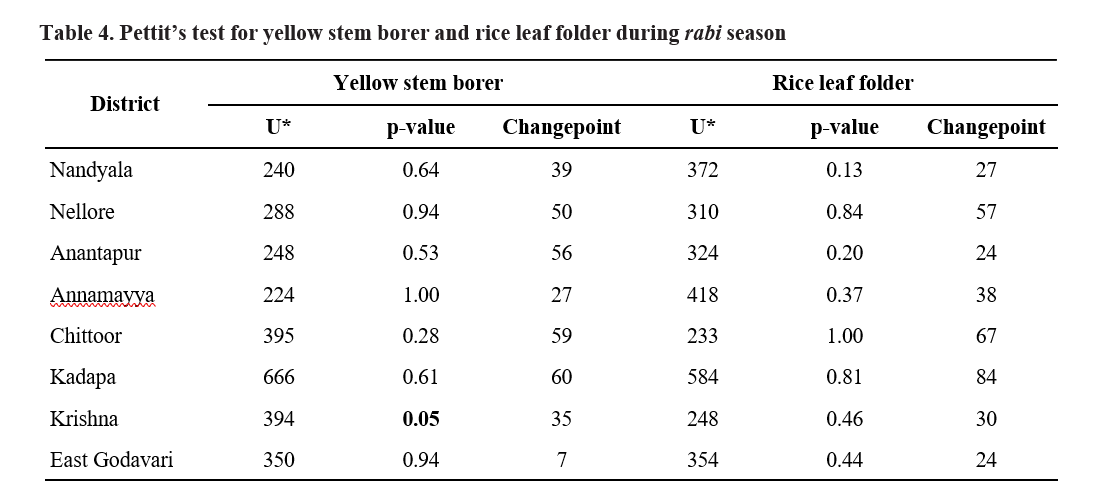
From Table-4, it is noticed that, during Rabi season, there was a change in the pattern of Yellow Stem Borer in Krishna district as the p-value is <0.05 concluded that a change point exists in the time series and for the remaining districts there is no change point as they are non-significant and there was no change point or pattern of Rice Leaf Folder in all districts.
The Buishand’s Range test is used to identify a single change point suddenly rather than gradual trends where the shift is at mean level. The test statistics (R) measures the range of cumulative deviations from the mean. An application of this test can be observed in Gaddikeri, V., et.al., 2024.
The Buishand’s Range test results during Kharif are presented in Table-5. From the results, Yellow Stem Borer (YSB) showed the change point at time K for the districts Nandyala, SPS Nellore, Anantapur, Annamayya, Chittoor and YSR Kadapa are at 44, 35, 10, 33, 33 and 87 respectively. As the p-values of Annamayya and Chittoor districts are <0.05 indicating significant change points exist in the time series whereas for the remaining districts there is no change point. For Rice Leaf Folder (RLF), the change point at time K for the districts Nandyala, SPS Nellore, Anantapur, Annamayya, Chittoor and YSR Kadapa are at 58, 43, 47, 19, 38 and 55 respectively. As the p-value for all the districts is >0.05 indicates no change point as it is non-significant.
The Buishand’s Range test results during Rabi are presented in Table -6. From the results, Yellow Stem Borer (YSB) showed the change point at time K for the districts Nandyala, SPS Nellore, Anantapur, Annamayya, Chittoor, YSR Kadapa, Krishna and East Godavari at 39,47,30,27,59,60,32 and 7 respectively. There was a change in the pattern of Yellow Stem Borer in the Anantapur district as the p-value is <0.05 concluded that a change point exists in the time series and for the remaining districts there is no change point as they are non-significant. For Rice Leaf Folder (RLF), the change point at time K for the districts Nandyala, SPS Nellore, Anantapur, Annamayya, Chittoor, YSR Kadapa, Krishna and East Godavari are at 33, 57, 24, 38, 19, 84, 30 and 10 respectively and there was a change in the pattern of Rice Leaf Folder in the Nandyala district as the p-value is <0.05 and for the remaining districts there is no significant change point as they are non-significant.
Descriptive statistics revealed the heterogeneity in the insect pest count data and coefficient of variation (CV%) indicating significant variability in pest incidence in all districts during two seasons. Pettit’s test identified a significant change or peak in the pattern of YSB in Krishna district during the Rabi season, whereas no significant changes or peaks were found in other districts for YSB. No significant peaks were found among all
districts in the patterns of RLF during the crop period in the Rabi season. Further, Buishand’s Range test detected a significant change point for YSB in Ananthapur district during Rabi and for RLF, significant change points were observed in Annamayya and Chittoor districts during Kharif. Hence, the findings suggest that pest patterns vary across districts and seasons, which is essential information for location-specific pest management strategies.
Buragohain, R., Saikia, H and Das, D. 2023. Trend Analysis and Change Point Detection of Winter Rice in North Bank Plains Zone (NBPZ) of Assam: A Non-parametric Approach. Electronic Journal of Applied Statistical Analysis. 16(2): 311-322.
Dubey, V., Panigrahi, S and Vidyarthi, V.K. 2023. Statistical trend analysis of major climatic factors over Chhattisgarh State, India. Earth Systems and Environment. 7(3): 629-648.
Gaddikeri, V., Sarangi, A., Singh, D.K., Jatav, M.S., Rajput, J. and Kushwaha, N.L., 2024. Trend and change-point analyses of meteorological variables using Mann–Kendall family tests and innovative trend assessment techniques in New Bhupania command (India). Journal of Water and Climate Change, 15(5), 2033-2058.
Hurtado, S.I., Zaninelli, P.G and Agosta, E.A. 2020. A multi-breakpoint methodology to detect changes in climatic time series. An application to wet season precipitation in subtropical Argentina. Atmospheric Research. 241: 104955.
Kumar, T., Singh, M.C and Singh, J.P. 2022. Trend Analysis of Groundwater Level, Rainfall and Area under Groundwater Irrigation in Ropar District of Punjab. Journal of Soil Salinity and Water Quality. 14(1): 108-116.
Laasya, K.N.V.L., Kallakuri, S., Rathod, S., Neelima, L., Meena, A and Jyostna, B. 2024. Statistical Assessment of Temperature Trends and Change Points in Telangana State, India. International Journal of Environment and Climate Change. 14(4): 397-407.
Mohammadi, H., Khalili, K., Rezaie, H. and Amini- Rakan, A., 2024. Analysis of Trend and Detection of Change Points in Lake Urmia Level and Climatological Parameters Using R Software. Water Harvesting Research, 7(2), .220-233.
Oganja, Y.H., Maheta, H.Y., Kumar, K. and Bharodia, C.R., 2024. Identification of mutation point and trend analysis of area, production, and yield of wheat crop in Gujarat, India. Asian Research Journal of Agriculture, 17(4), 150-156.
Polisetty, K., Paltati, G and Paidipati, K.K. 2023. An empirical study on assessment of trend analysis: Food grain production in India. Journal of Agricultural Sciences (Belgrade). 68(3).
Ragab, R.M., Amin, D., Elmoustafa, A.M. and Ali, N.A., 2024. Rainfall trend detection using statistical tests in North Coast of Egypt. Theoretical and Applied Climatology, 155(9), 8871-8885.
Savary, S., Willocquet, L., Elazegui, F.A., Teng, P.S., Van Du, P., Zhu, D., Tang, Q., Huang, S., Lin, X., Singh, H.M and Srivastava, R.K. 2000. Rice pest constraints in tropical Asia- characterization of injury profiles in relation to production situations. Plant Disease. 84(3): 341-356.
Yildirim, G and Rahman, A 2022. Homogeneity and trend analysis of rainfall and droughts over Southeast Australia. Natural Hazards. 112(2): 1657-1683.
Zarenistanak, M., Dhorde, A.G and Kripalani, R.H. 2014. Trend analysis and change point detection of annual and seasonal precipitation and temperature series over southwest Iran. Journal of earth system science. 123: 281-295.