
0 Views
N. PRIYANKA EVANGILIN*, B. RAMANA MURTHY, G. MOHAN NAIDU AND Sk. NAFEEZ UMAR
Department of Statistics and Computer Applications, S.V. Agricultural College, ANGRAU, Tirupati.
The present research study was carried out to identify the appropriate time series model for predicting production of
Tobacco in India by using Box-Jenkins Auto Regressive Integrated Moving Average (ARIMA) models for the period 1950-51 to
2016-17.The validity of the models were statistically tested by on the basis of goodness of fit criteria’s viz., Highest R2
, Lowest
Root Mean Square Error (RMSE) and Mean Absolute Percentage Error (MAPE). Among all the models ARIMA (2, 0, 3) model
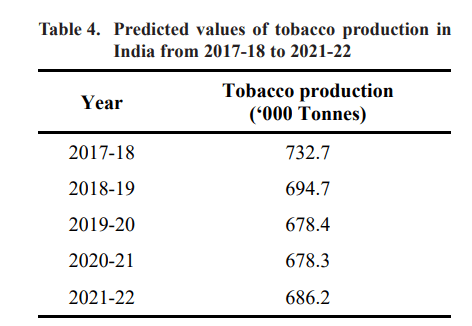
was found to be the best fitted model for predicting production of Tobacco in India for further five years. The forecasted results
showed for production of Tobacco for the year 2021-22 is to be 686.2thousand tonnes. And the results showed, there is a
decreasing trend on production from 2017-18 to 2020-21 and then increased on 2021-22.
Tobacco, production, time series and ARIMA model.
Tobacco (Nicotiana tabacum) is an annually-grown herbaceous plant. It was introduced into India by Portuguese traders during AD 1600. India is the world’s 2nd largest producer of tobacco with an estimated annual production of around 800 million kg. Tobacco occupies
a meagre 0.24% of the country’s total arable land area. It is grown largely in semi-arid and rain-fed areas where the cultivation of alternative crops is economically unviable. Andhra Pradesh, Gujarat, Karnataka, Maharashtra, Bihar and Tamil Nadu were the leading tobacco producing states in India. Its leaves are commercially grown in many countries to be processed
into tobacco. The tobacco industry in India includes the production, distribution and consumption of (i) Leaf tobacco, (ii) Smoking products such as cigarettes and beedis and (iii) various chewing tobacco products. Tobacco has developed as a cash crop because its contributing substantially to the total agricultural income,yields high net returns per unit of cultivation as compared to other crops, employment opportunities, both in agriculture and activities involved in the manufacture of tobacco products, a major foreign exchange earner. The production of tobacco in India 806 thousand tonnes in 2016-17 (www.indiastat.com).
Prabakaran and Sivapragasam (2014) were studied forecasting areas and production of rice in India using ARIMA models. It was found that the forecasted rice cultivated areas and production were to increase in the next four years.
Baser et al. (2018) fitted ARIMA model for Forecasting Chestnut Production and Export of Turkey for the period of 1961-2016. They obtained ARIMA (1,1, 1) and ARIMA (1, 2, 1) models were best fitted models and they conclude that Turkey’s chestnut production and export would be increased in the forecasted years.
Murthy et al. (2018) was made an attempt to develop an appropriate ARIMA model for forecasting groundnut area, production and productivity of India. They have concluded that ARIMA (2, 1, 3), ARIMA (3, 0, 3) and ARIMA (2, 1, 3) models were best fitted to forecast area,production and productivity of groundnut in India. For four leading years, they have found that there was a decreasing trend on area and fluctuations on production and productivity from the period 2016-17 to 2019-2020.
Murthy et al. (2018) studied the appropriate ARIMA model for forecasting sunflower production in India and they found that ARIMA (4, 1, 4) model was the best fitted model to forecast Sunflower Production in India and also they were observed that there is a downward and upward
trend on production of sunflower in India for forecasted years.
The objective of the present study is to identify the appropriate time series model for predicting production of Tobacco in India by using Box-Jenkins Auto Regressive
121 Integrated Moving Average (ARIMA) model, and also to forecast next five year future values based on selected model.
The data of study for a period of 67 years (1950-51 to 2016-17) in India pertaining to Production (‘000 tonnes) of Tobacco was collected from the source of Govt.of India in www.indiastat.com. In order to examine the nature of change in production of Tobacco in India by ARIMA time series models was worked out by using statistical package SPSS 22 version.
The ARIMA methodology is also called as BoxJenkins methodology (Box and Jenkins 1976). Box and
Jenkins (1976) established that these parameters can be obtained through trial and error approach after examining the Auto Correlation Function (ACF) and Partial Auto Correlation Function (PACF). The first step in developing ARIMA model is to examine data for stationarity. This can be identified through Auto Correlation Function (ACF) of actual data, if the auto correlation function does not die out rapidly, it indicate that the data are nonstationary. Under this situation, the auto correlation corresponding to most of lags are statistically significant. For reducing the data to stationarity, the data are therefore transformed by taking first order differences (d = 1). If the auto correlation functions of differenced data indicate a rapid decrease, then it can be concluded that thetransformed data is stationary. If not again the data has to be transformed by taking second order differences (d =2). Continuing in a similar way as that of d = 1, the order of differencing i.e., d can be determined. After
determining the differencing order ‘d’, the order of auto regressive (p) and moving average (q) components, can be obtained as follows:
If the auto correlation function corresponding to the transformed data decays after the qth lag, then it is taken as MA (q) model; likewise, if partial auto correlation function indicates a decaying after pth lag, it indicates existence of AR (p) model i.e., the characteristics p and q are determined on the basis of PACF and ACF of the stationary data.
The Box-Jenkins procedure is concerned with fitting a mixed ARIMA model to a given set of data. The main objective in fitting ARIMA model is to identify the stochastic process of the time series and predict the future values accurately. This method shave also been useful in
many types of situations which involve the building of models for discrete time series and dynamic systems. However the optimal forecast of future values of a time series are determined by the stochastic model for that series.
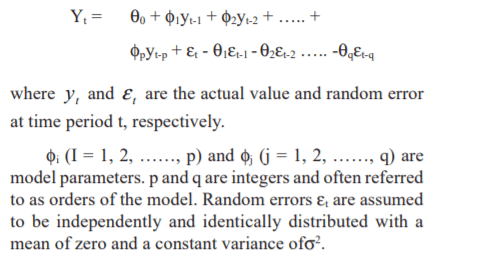
The ARIMA (p, d, q) process is given by
The main stages in setting up a Box-Jenkins forecasting model are as follows:
1. Identification
2. Estimating the parameters
3. Diagnostic checking
4. Forecasting
In the present study, the data for production of Tobacco in India for the period of 67 years (1950-51 to 2016-17) were used for the study.
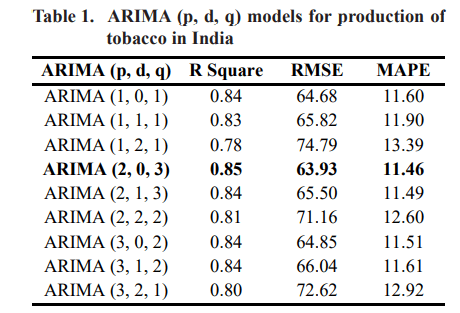
Among several models of ARIMA (p, d, q) studies the goodness of fitted models were examined by highest R2 value, lowest RMSE (Residual Mean Square Error)and lowest MAPE (Mean Absolute percentage Error) values. Based on these criterions, it was found that ARIMA (2, 0, 3) are the best fitted model for forecasting Tobacco production in India. The Coefficient of determination (R2), Mean Absolute Percentage Error (MAPE) and Residual Mean Square Error (RMSE) are given by
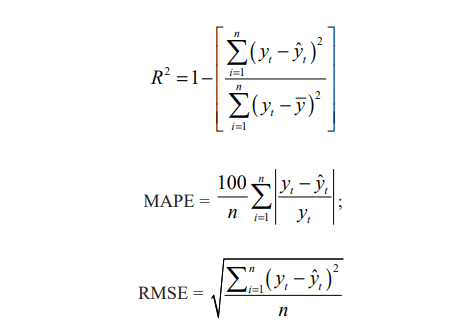
where t y is the actual observation for time period ‘t’ and ˆt y is the predicted value for the same period and y is the overall sample mean of observations. The models and the corresponding values are shown in Table 1
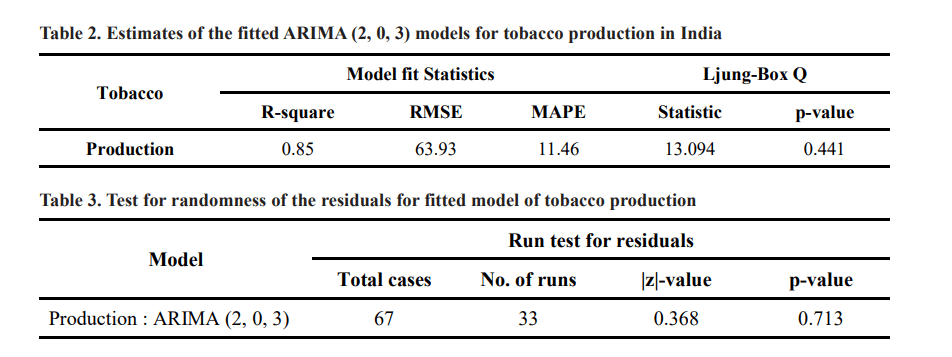
(b) Model Estimation and Verification The parameters of the model were estimated by using
SPSS 22 version. The ARIMA (2, 0, 3) was found to be best fitted model for production of Tobacco. The model verification (or) diagnosed by the Ljung-Box Q statistic. The Ljung-Box Q statistic is to check the overall adequacy of the model. The test statistic Q is given by

where rl(e ) is the residual autocorrelation at lag l , nr is the number of residual, n is the number of time lags included in the test for model to be adequate, p-value associated with Q statistics should be large (p-value>α).The results of estimation are reported in Table 2.
Non-parametric one sample run test can be used to test the randomness of residuals. For small samples i.e.,both n1 and n2 are equal to or less than 20 if the number of runs ‘r’ fall between the critical values, we accept the H0 (null hypothesis) that the sequence of binary events is random otherwise, we reject the H0. For large samples i.e., if either n1 or n2 is larger than 20, a good approximation to the sampling distribution of r (runs) is the normal distribution, with mean and standard deviation
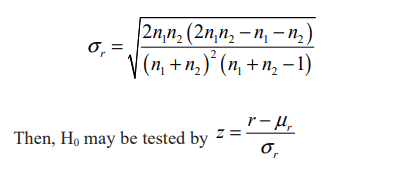
The significance of any observed value of Z computed from the above formula may be determined by reference to the standard normal distribution Table 3.(d) Forecasting with ARIMA model
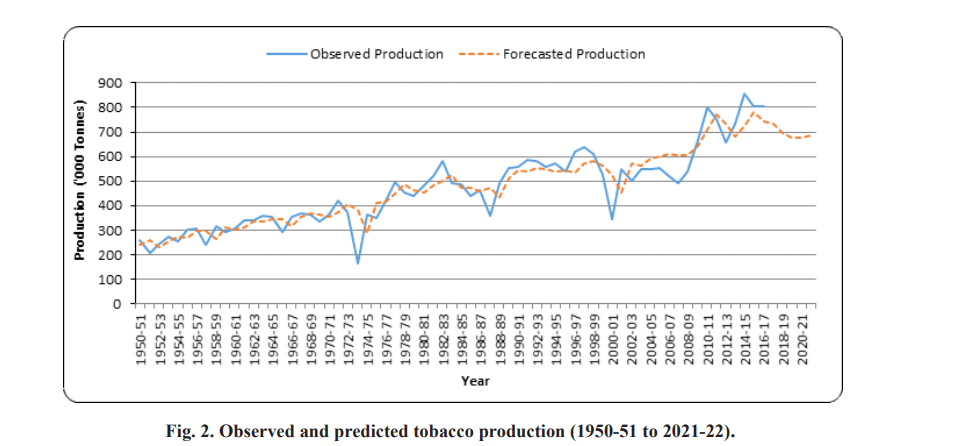
After the identification of the model and its adequacy check, it is used to predict the production of Tobacco for the next five periods. Hence we used the identified ARIMA model to predict production of Tobacco for the years 2017-18 to 2021-22. The predicted results are
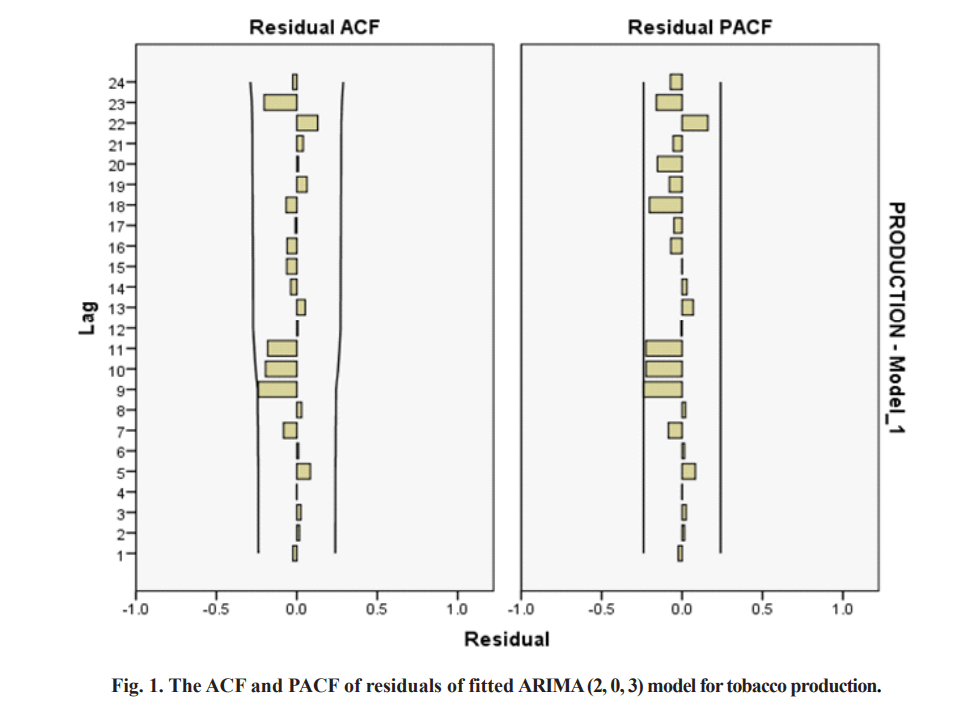
presented in Table 4. The ACF and PACF of residuals of fitted ARIMA model for Tobacco production are presented in Fig. 1 and also the diagrams of actual and predicted values are presented in Fig. 2.
In the present study, the identified ARIMA (2, 0, 3) was the best model for forecasting the Tobacco production based on highest R2, lowest RMSE and MAPE criterions in India. The study revealed that the trend on production of tobacco was decreased from 2017-18 to 2020-21 and
then trend increased on 2021-22. Due to Uncertain
Monsoons and Inadequate Irrigation Facilities, low price in market etc., the production of tobacco was fluctuated.All parts of the plant contain nicotine, which can be extracted and used as an insecticide. Tobacco is a great pest poison for the garden, and tobacco leaves has so many uses. So that, the agricultural farmers should take more attention to increase the production of Tobacco in India by using new technologies in cultivation.
Box, G.E.P and Jenkin, G.M. 1976. “Time Series of Analysis, Forecasting and Control”, Sam Francisco, Holden Day, California, USA
Baser, U., Bozoolu, M., Eroolu, N.A and Topuz, B.K.
2018. Forecasting chestnut production and export of Turkey using ARIMA model. Turkish Journal of Forecasting. 2(2): 27-33.
Prabakaran, K and Sivapragasm, C. 2014, Forecasting areas and production of rice in India using ARIMA Model. International Journal of Farm Science. 4(1):99-106.
Murthy, B.R., Mohan Naidu, G., Ravindra Reddy, B and Nafeez Umar, Sk. 2018. Forecasting groundnut area,production and productivity of India using ARIMA Model. International Journal of Agricultural and Statistical Sciences. 14(1): 153-156.
Murthy, B.R., Umar, N.Sk and Babu, O.H. 2018. ARIMA models for forecasting sunflower production in India.
International Journal of Pure and Applied Bioscience. 6(6): 1121-1126.
Murthy, B.R., Naidu, G.M., Tamilselvi, C and Evangilin, N.P. 2020. Validation of ARIMA Model on production of papaya in India. Indian Journal of Pure and Applied Biosciences. 8(2): 64-68