
0 Views
Department of Crop Physiology, S.V. Agricultural College, ANGRAU, Tirupati-517 502.
Pigeon pea (Cajanus cajan (L) Millsp.) is an important pulse crop of India and it is extensively grown under rainfed conditions. Medium to long duration nature of the crop makes it more vulnerable to terminal moisture stress, especially that coinciding with the critical periods of growth. It is a short-day legume species, and the late maturing genotypes are more photosensitive than early types. Unfortunately, in spite of high importance of photo-insensitivity in super early and mid-early genotypes, availability of genotypes suitability to particular location is meagre. Plant density under rainfed conditions pronounces significant effect on pigeon pea performance under limited supplemental irrigation conditions. A field experiment entitled “Influence Of High Density Planting On Yield Parameters Of Super Early And Mid Early Varieties Of Redgram (Cajanus Cajan (L.) Millsp.)” was conducted during rabi, 2023 at wetland farm, S. V. Agricultural College, Tirupati with three different spacings with four varieties (super early and mid-early varieties) in factorial randomized block design and replicated thrice. The three different spacings viz., 30 cm × 15 cm, 45 cm × 15 cm and 60 cm × 15 cm, whereas the varieties chosen among super early varieties are ICPV 21111 and ICPV 21222, among mid early varieties PRG 176 and TS3R.
KEYWORDS: Photo-insensitivity, Super early & Mid early varieties, Terminal Moisture stress, Supplemental irrigation.
Pulses form an integral part of vegetarian diet in Indian subcontinent. It is an important source of proteins. Pigeonpea (Cajanus cajan (L.) Millsp) (2n= 22) commonly known as redgram or arhar or tur in India. Globally, redgram is grown in an area of 60.96 lakh hectares with a production of 50.12 lakh tonnes and productivity of 822.2 kg ha-1 (FAO STAT, 2020).
India ranks first in redgram production globally with 42.8 lakh tonnes cultivated under 48.24 lakh hectares with the productivity of 887 kg ha-1 in 2020-21 (agricoop. nic.in). In Kharif 2021-22, redgram production was 44.3 lakh tonnes (1st advance estimates) with an area of 50.02 lakh hectares (agricoop.nic).
However, about 2-3 million tons of pulses are imported annually to meet the domestic consumption requirement accounting for 21.50 per cent of total food imports. In India, pigeonpea is cultivated in an area of 4.55 million hectares with production and average productivity of 3.32 million tonnes and 729 kg ha-1, respectively.
Andhra Pradesh produced 0.84 lakh tonnes contributing 1.96 % to total India’s production cultivated in an area of 2.31 lakh hectares with 363 kg ha-1 productivity in 2020-21. The negative response in pods plant-1 to increasing plant densities. Deep rooting and drought tolerant characters of redgram make it a successful crop in areas of low and uncertain rainfall.
High density planting is normally understood as a system where in a higher number of plants are accommodated in a unit area as compared to the conventional planting. It induces precious pod bearing, higher returns per unit area, early returns are achieved and lower labor costs, resulting in a low cost of production
The intense competition for growth resources was evident from increase in plant population density. This is probably caused through stem elongation and increase of number of nodes plant-1 due to mutual shading.
The increase in plant population density increases node length as well as the lowest pod height. This in turn contributed to decreased number of branches plant-1 which supports the previous reports. Plants at higher densities accumulate less carbon which is not sufficient to support more branching. On the other hand wider spacing of pigeonpea plants resulted in more number of branches plant-1.
The present investigation entitled “Influence of high density planting on yield parameters of super early and mid-early varieties of redgram” was done at wetland farm of S.V. Agricultural College, ANGRAU, Tirupati during Rabi, 2022. The soil was sandy clay loam in texture, alkaline in soil reaction (6.8 pH), low in organic carbon(0.19 %), medium in available phosphorous(54.5 kg ha-1) and potassium, low in available nitrogen(283.5 kg ha-1). Three replications of the experiment were done using a factorial randomized block design. There are two factors such as varieties and spacings. Among varieties two super early varieties (ICPV 21111, ICPV 21222) and two mid-early varieties (PRG 176, TS3R). There are three different spacings such as 30 cm × 15 cm, 45 cm × 15 cm and 60 cm × 15 cm. Recommended dose of fertilizer was @ 25-30 kg N, 50 kg P2O5 ha-1 and 30 kg K2O ha-1 through urea, single super phosphate and muriate of potash (MOP) respectively. . The data collected on various crop parameters were statistically evaluated using the factorial randomised block design method recommended by Panse and Sukhatme (1985).
Among different spacings, there was lesser mean number of mature pods with 60 cm ×15 cm (23.08). More number of mature pods was observed with a spacing of 45cm ×15 cm (27.71) followed by 30 cm × 15 cm (25.87). Among the super early varieties higher number of mature pods recorded by ICPV 21222 (25.18) and less number of mature pods recorded followed ICPV 21111 (24.36). Among the mid early varieties higher number mature of pods recorded by TS3R (26.95) and less number of mature pods recorded by PRG 176 (25.73). With regard to interaction, the mature pods were non-significant. Significant difference in immature pods was observed between the spacings and varieties, but their interaction was found to be non-significant. Among different spacings, there was lesser mean number of immature pods with 30 cm × 15 cm (62.7). More number of immature pods was observed with a spacing of 45 cm × 15 cm (66.1) followed by 60 cm × 15 cm (64.1). Among the mid early varieties higher number of pods recorded by PRG 176 (74.7) and less number immature pods recorded followed TS3R (74.8). With regard to interaction, the immature pods were non-significant. The pod number increased in non-competitive spacing owing to least inter plant competition and greater availability of growth resources viz., light, moisture, nutrients and space for each plant. Likewise Mahajan et al. (1997) attributed pigeon pea yield compensation at low densities to increased number of pods plant-1.
The number of seeds pod-1 was maximum with the spacing of 45 cm × 15 cm, which was higher among the other spacings. Among different spacings, there was lesser mean number of seeds pod-1 was with spacing 60 cm ×15 cm (3.26). More number of seeds pod- 1 was observed with a spacing of 45cm ×15 cm (3.93) followed by 30cm × 15 cm (3.29). Among the mid early varieties higher number of seeds pod-1 was recorded by TS3R (3.45) and less number seeds pod-1 was notice in PRG 176 (3.44). With regard to interaction, the number of seeds pod-1 was non-significant. In both varieties and spacings studied, seeds pod-1 was not significantly influenced by varying plant densities. These results are in conformity with the findings of Telgote et al. (2004) and Saritha et al. (2012).
Analysis of the data indicated that the spacings and varieties were found significant at harvest whereas, their interactions were non-significant. Among different spacings, there was lower mean value of hundred seed weight with 60 cm × 15 cm (8.7 g). More hundred seed weight was observed with a spacing of 45 cm × 15 cm (9.52 g) which was on par with 30cm × 15 cm (9.50 g). Among the super early varieties higher hundred seed weight recorded by ICPV 21111 (8.7 g) and less hundred seed weight recorded followed ICPV 21222 (8.8 g). Among the mid early varieties higher hundred seed weight recorded by TS3R (9.8 g) recorded less number seeds per pod-1 which was on par with PRG 176 (9.6 g). With regard to interaction, the hundred seed weight were non-significant. The probable reason for increase in test weight may be the genetic make-up of the variety that has helped in improving the photosynthetic activity due to increased source capacity and efficient translocation of photosynthesis to the sink. The results were in accordance to Siddikee et al. (2018).
The seed yield was maximum with the spacing of 45 cm × 15 cm, which was significantly higher compared to all other spacings. Among the super early varieties the significantly high seed yield was recorded by ICPV 21222 (429.4 kg ha-1) followed by ICPV 21111 (426.8 kg ha-1). Among the mid early varieties the significantly high seed yield was recorded by TS3R (1471.3 kg ha-1) followed by PRG 176 (1432 kg ha-1). The intense competition for growth resources was evident from increase in plant population density. This is probably caused through stem elongation (Pendersen and Lauer, 2003) and increase of number of nodes plant-1 (Oh et al. 2007) due to mutual shading (Dominguez and Hume, 1978).
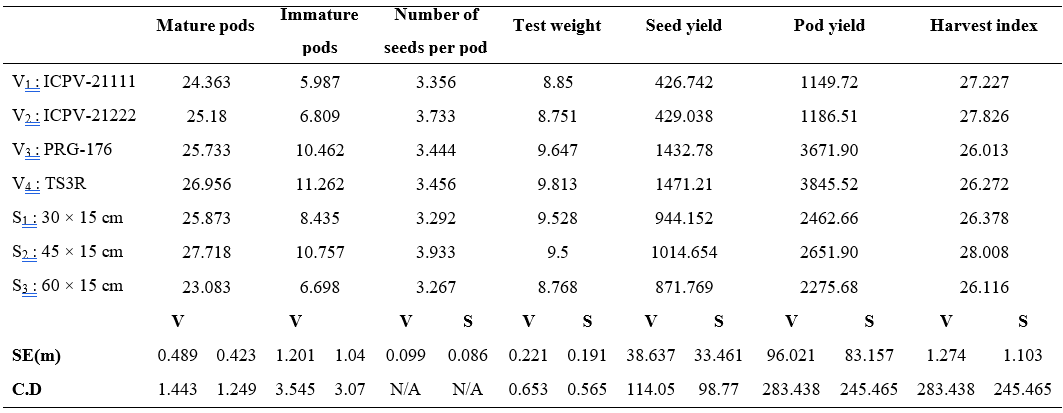
The pod yield was maximum with the spacing of 45 cm × 15 cm, which was significantly higher compared to all other spacings. Among the super early varieties the significantly high pod yield was recorded by ICPV 21222 (1186.5 kg ha-1) followed by ICPV 21111 (1149.7 kg ha-1). Among the mid early varieties the significantly high pod yield was recorded by TS3R (3845.5 kg ha-1) followed by PRG 176 (3671.9 kg ha-1). The superior values of yield and its component were noticed under wider spacing may be attributed to better growth and development of plants under less plant population density and it resulted into better source to sink relationship, due to availability of balanced and adequate nutrients and better light, space and moisture unlike in narrow spacing. These results are in conformity with those of Ali et al. (2007) in pea, Shah et al. (2007) in pea and Shrikanth et al. (2008) in lablab bean.
Significant variability in harvest index was observed among the all spacings at harvest. Among the super early varieties the significantly harvest index was recorded at harvest by ICPV 21222 (27.82%) on par with the ICPV 21111 (27.22%). Among the mid early varieties the significantly high harvest index was recorded at harvest by TS3R (26.27%) on par with the PRG 176 (26.01%). Among different spacings, there was lower mean value of harvest index with 60 cm ×15 cm (26.11%). More harvest index was observed with a spacing of 45cm ×15 cm (28.00%) followed by 30cm ×15 cm (26.37%).The interaction between spacing and varieties were found non- significant at harvest. The maximum harvest index may be accounted as a function of growth in wider row spacing which improved the source-sink relationship by enhancing the diversion of photosynthates towards vegetative parts to reproductive parts. These results are in conformity with those of Bansal et al. (2023).
Agricoop.nic.in. First advance estimates of production of food grain for 2020-21.
Ali, E.H., Abdulla, A.A and Obaid, A.K. 2007. Effect of plant spacing on growth and yield of two pea cultivars (Pisum sativum L.) sown in Southern of Iraq. Basrah Journal of Agricultural Sciences. 20(2):123.
Dominguez, C and Hume, D.J. 1978. Flowering, abortion and yield of early-maturity soybeans at three densities. Agronomy Journal. 70: 801-805.
Bansal, K.K., Kumar, V., Attri, M., Jamwal, S., Kumari, A and Kour, K. 2023. Impact of spacing variability on pigeon pea genotypes: A study of growth evaluation, productivity, quality, and profitability. Biological Forum – An International Journal. 15(7): 157-163.
Mahajan, J.P., Dumbre, A.D and Bhingarde, M.T. 1997. Effect of environments, fertilizers and plant density on seed yield and quality of pigeonpea. Journal of Maharashtra Agricultural Universities. 22: 151- 154.
Panse, V.G and Sukhatme, P.V. 1985. Statistical methods for agricultural research. ICAR, New Delhi. 8: 308- 318.
Pendersen, P and Lauer, J.G. 2003. Corn and soybean response to rotation sequence, row spacing and tillage system. Agronomy Journal. 95: 965-997.
Saritha, K.S., Pujari, B.T.S., Basavarajappa, R., Naik, M.K., Babu, R. and Desai, B.K. 2012a. Effect of irrigation, nutrient and planting geometry on yield, yield attributes and economics.
Shah, V.K., Shakya, S.M., Gautam, D.M., Srivastana, 2007. Effect of sowing time and row spacing on yield and quality of seed of pea crop at Rampur, Chitwan. Journal of the Institute Agriculture and Animal Science Research Advance. 1: 59-64.
Shrikhanth, Merwade, M.N., Channaveerswami, A.S., Tipakannanavar, S., Mallapur, C.P., Hosamani, R.M. 2008. Effect of spacings and fertilizer levels on growth and seed yield in lablab bean (Lablab purpureus L.). Karnataka Journal of Agricultural Sciences. 21(3): 440-443.
Siddikee, M.R., Sultana, R., Hasan, M., Rahman, T., and Siddique, A.B. 2018. Effect of Nitrogen Sources on the Yield of Different Blackgram (Vigna mungo) Varieties. Asian Research Journal of Agriculture. 10(3): 1-8.
Telgote, N.C., Aher, R.P and Parmar, J.N. 2004. Effect of spacing and fertility levels on yield of pigeonpea. Annals of Plant Physiology. 18(1): 58-60.