
0 Views
Institute of Agribusiness Management, S.V. Agricultural College, ANGRAU, Tirupati – 517 502.
The rapid advancement of modern technologies has brought significant transformations in the agricultural sector and farm level crop intelligence systems have emerged as a potential game changer for the horticulture industry. This study aimed to explore the scope of farm level crop intelligence systems in horticulture crops by investigating their usage in various farm operations. The research also analyzed the association between socio-demographic variables, such as age, education, farming experience, and farm size and the adoption of crop intelligence systems by farmers. The methodology involved collecting primary data through a survey of 100 sample respondents using well-structured schedule. The data were analyzed using percentage analysis to measure the extent of adoption and the chi-square test to assess the associations between variables. The results indicated that among the sample farmers, 50% have adopted crop intelligence systems for their farm operations. These systems were predominantly used for weather prediction (92%), irrigation alerts (100%), forewarning of pest and disease incidence (98%) and decision-making for other farm operations (96%). Regarding the association between socio-demographic variables and adoption of crop intelligence systems, age and education of farmers were found to have no significant impact on adoption. However, there was a significant association between farming experience and farm size with the likelihood of adoption of crop intelligence systems.
KEYWORDS: CIS, Farm level, Horticulture crops, Scope.
The agricultural landscape is rapidly evolving with the advent of modern technologies and farm level crop intelligence systems are emerging as a game-changer for the horticulture sector. As the demand for high-quality produce increases to meet the needs of a growing global population, farmers facing the challenge of optimizing productivity while ensuring sustainability. In this context, farm level crop intelligence systems powered by data-driven insights and advanced technologies, holds tremendous promise to revolutionize horticulture crop operations.
Farm level crop intelligence systems encompass a suite of innovative tools and methodologies designed to assist farmers in making informed decisions at every stage of crop cultivation. Integrating cutting-edge technologies such as remote sensing, artificial intelligence, IoT devices and data analytics. These systems provide farmers with real-time and historical data, enabling them to monitor, manage and optimize their horticulture crops more efficiently than ever before. These crops are often characterized by their sensitivity to environmental factors and require precise cultivation techniques. Farm level crop intelligence systems leverages IoT devices and smart sensors scattered across the fields to collect real- time data on various parameters, including soil moisture,
temperature and weather conditions. This continuous monitoring enables farmers to make data-driven decisions and adopt proactive measures, enhancing crop health and ensuring optimal growth conditions. The horticultural crops are susceptible to diseases and pest infestations, which can significantly impact yields. Farm level crop intelligence systems aids in early detection of potential threats through image recognition and data analysis. By spotting issues early, farmers can implement timely measures, reducing crop losses and minimizing the need for extensive chemical treatments.
variables influencing the adoption of farmers
To accomplish the above objectives of the study the primary data regarding the usage of crop intelligence systems for various farm operations and socio- demographic variables of sample respondents were collected through survey method with the help of well- structured schedule and involved a sample size of 100 respondents.
Percent increase and percent decrease are measures gains or losses intensity, magnitude, extent or value. The figures are arrived at by comparing the initial (or before) and final (or after) quantities according to a specific formula. It is assumed that both the initial and the final
quantities are positive (larger than 0).
Suppose a quantity has an initial value of x1, and then increases or decreases to a final value of x2. The percent change, D percent, is calculated by finding the difference x2 – x1 (subtracting the initial value from the final value), then dividing the results of this subtraction by x1 (the initial value), and finally multiplying by 100. Expressed as a formula:
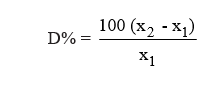
where,
D% : Percentage change x1 : The initial value
x2 : The final value
To compare the observed frequencies with an expected group of frequencies, we must be able to state what frequencies would be expected. The hypothesis is H0 states the proportion of objects falling in each of the categories in the presumed population. The chi- square technique gives the probability that, the observed frequencies could have been sampled from a population with the given expected values.
The null hypothesis H0 may be tested by using the following statistics:
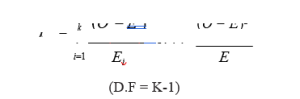
Oi = Observed number of cases in the ith category
Ei = Expected number of cases in the ith category
when H0 is true.
K = Number of categories
If the value of c2 is greater than the table value of c2 at specified level of significance for (K-1) degrees of freedom, it will be significant and then we shall be justified in suspecting significant divergence between the fact and theory and rejecting the null hypothesis of equality of two sets of observed and expected frequencies.
If the value of c2 is non-significant, it justifies the agreement between the observed fact and the theory or hypothesis. If the value of c2 is equal to zero the agreement is perfect. In practice, it is very rare to get c2 = 0 and therefore, we start suspecting our sampling technique by declaring that this perfect agreement between the fact and theory is good to be true.
The information particulars of sample farmers regarding their usage of farm level crop intelligence systems for various farm operations such as weather prediction, irrigation alerts, forewarnings of pest and disease incidence, decision making on other farm operations and mitigation of risks associated were collected and the obtained results are presented in Table 1.
Results of the Table 1 confers that, among total sample farmers of 100, 50 farmers adopted crop intelligence systems in their farms and are using the technology for various farm related operations. Of the
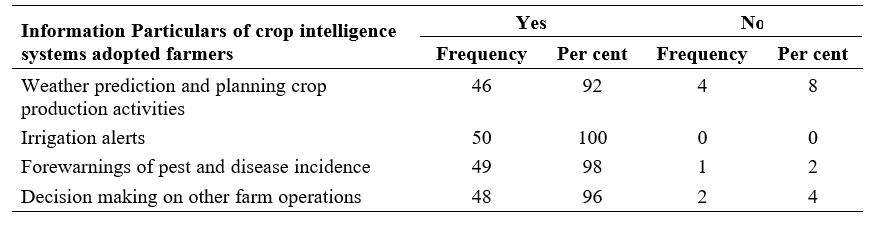
for weather prediction and planning crop production activities, 100 per cent of adopted farmers were using the systems for irrigation alerts while 98 percent of adopted sample farmers using it for forewarnings of pest and disease incidence. Further, around 96 per cent of adopted farmers were using these systems for better decision making of other farm operations such as pesticide applications and weeding. Thus, the results indicated that among the sample farmers who adopted crop intelligence systems in their farms, 92 per cent were using these systems for weather prediction, 100 per cent for irrigation alerts, 98 per cent for forewarning of pest & disease incidence and another 96 per cent for making decisions related to other farm operations.
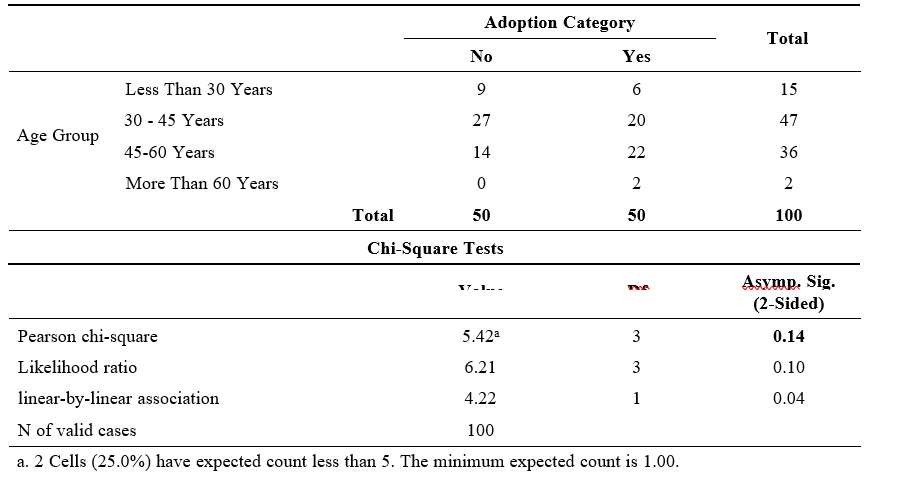
Chi- square test was employed to identify whether there exists any significant association between age, education and farm size of the farmers with regards to their adoption for crop level farm intelligence systems and the results are presented below:
There exists no significant association between age, education, farm size of sample farmers and adoption for crop level farm intelligence systems
There exists significant association between age, education, farm size of sample farmers and adoption for crop level farm intelligence systems
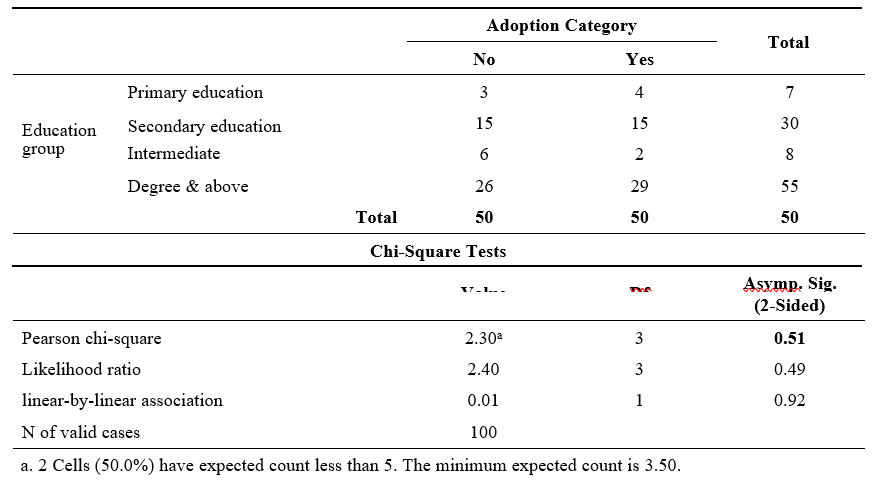
The results presented in Table 2. and Table 3. indicated that, there exists no significant association between age and education of the sample farmers with regard to their adoption for crop level farm intelligence systems as the chi-square values for the age (Chuang et al., 2020) and education are greater than 0.05 (0.143 and
0.511 respectively). Hence, we accept null hypothesis that there exists no significant association between age and education of sample farmers and their adoption for crop level farm intelligence systems.
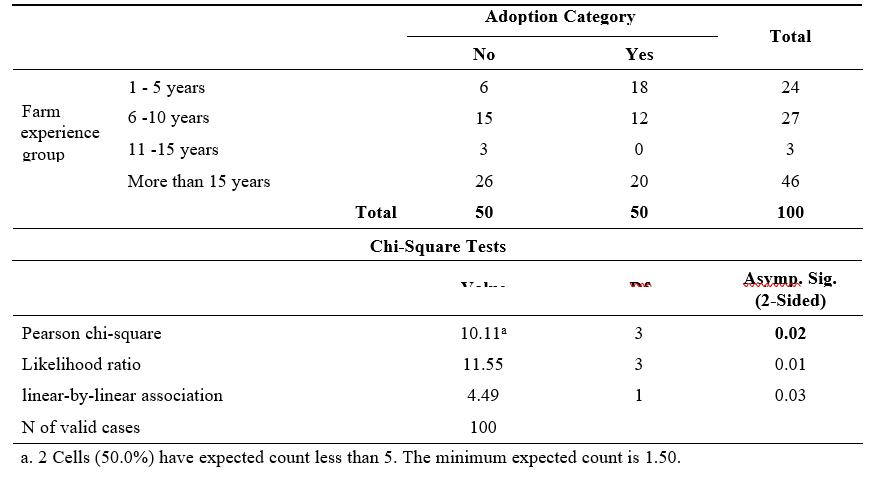
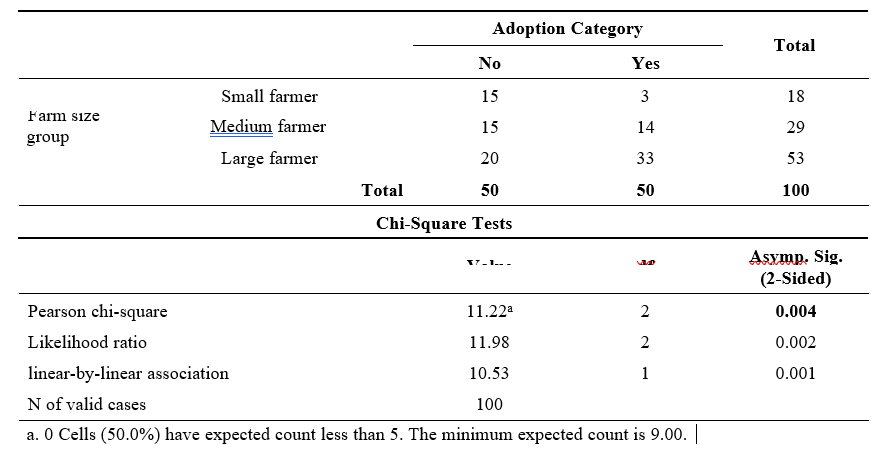
The results presented in Table 4. and Table 5. indicated that, there exists significant association between farming experience and farm size (Hoang, 2020) of the sample farmers with regard to their adoption for crop level farm intelligence systems as the chi-square values for the farming experience and farm size are less than 0.05 (0.018 and 0.004 respectively). Hence, we reject null hypothesis that there exists significant association between faming experience and farm size of sample farmers and their adoption for crop level farm intelligence systems.
Among total sample of 100 farmers, 50 farmers were adopted crop intelligence systems in their farms and using the technology for various farm related operations. Of the adopted farmers, 92 per cent were using these systems for weather prediction and planning crop production activities, 100 per cent of adopted farmers were using the systems for irrigation alerts while 98 percent of adopted sample farmers using it for forewarnings of pest and disease incidence. Further, around 96 per cent of adopted farmers were using these systems for better decision making of other farm operations such as pesticide applications and weeding.
There is no significant association exists between age and education of the sample farmers with regard to their adoption for crop level farm intelligence systems as the chi – square values for the age and education are greater than 0.05 (0.143 and 0.511 respectively).
There exists significant association between farming experience and farm size of the sample farmers with regard to their adoption for crop level farm intelligence systems as the chi – square values for the farming experience and farm size are less than 0.05 (0.018 and 0.004 respectively).
The results indicated that among sample farmers who adopted crop intelligence systems in their farms,
92 per cent were using these systems for weather prediction, 100 per cent for irrigation alerts, 98 per cent for forewarning of pest & disease incidence and another 96 per cent for making decisions related to other farm operations. Age and Education showed no association with the adoption of farm level crop intelligence systems. The higher the farming experience and larger the landholdings, increases the likelihood of adoption of farm level crop intelligence systems.
Chuang, J.H., Wang, J.H and Liang, C. 2020. Implementation of Internet of Things depends on intention: Young farmers’ willingness to accept innovative technology. International Food and Agribusiness Management Review. 23(2): 253-266.
Hoang, H.G. 2020. Determinants of the adoption of mobile phones for fruit marketing by Vietnamese farmers. World Development Perspectives. 17: 1-8.