
0 Views
L. MADHAVILATHA*, M. SUBBA RAO, M. SHANTHI PRIYA AND M. HEMANTH KUMAR
Department of Genetics and Plant Breeding, Agricultural Research Station, Perumallapalle, Tirupati
Fifty genotypes of little millet were evaluated for genetic divergence for nine quantitative traits. Genetic divergence was
estimated by using Mahalanobis’s D2 statistics and genotypes were grouped into nine clusters. Among the clusters cluster I
comprised of twenty three genotypes, cluster II had nine genotypes, cluster III had eight genotypes, cluster V had five genotypes
and the remaining clusters IV, VI, VII, VIII and IX consisted of one genotype each. The maximum inter cluster D2 value was
observed between cluster IX and VI followed by between cluster IX and V, cluster IX and II, cluster IX and IV and cluster IX and
I which indicated that the genotypes from these clusters would be utilized in crossing programme to develop high yielding little
millet varieties. The genotype in cluster IX recorded high grain yield per plant followed by genotype in cluster VII which can be
utilized directly in crop improvement programme.
Little millet, genetic divergence, DUS traits, D2 statistics.
Little millet (Panicum sumatrense) is one of the most important small millet crops popularly known as ‘sama’, samo, vari, or kutki, belongs to the family Poaceae and sub family Panicoideae (Nirmalakumari et al., 2010). In India little millet is cultivated in an area of 2.34 lakh hectares with annual production of 1.27 lakh tonnes and productivity of 544 kg ha-1. In Andhra Pradesh little millet is grown in an area of 7000 ha with production of 3000 t and productivity of 354 kg ha-1 (Anonymous, 2018). Due to huge demand for millets in the recent years there is a need to increase the productivity levels by developing high yielding millet varieties. Among the small millets, little millet is the most under researched crop in terms of useful genetic and genomic resources available to breeders for genetic enhancement. Though, the crop has been important over centuries, more concentrated research efforts are geared in recent years to evolve improved varieties and develop production technologies. To conduct a successful breeding programme knowledge of genetic divergence is of prime importance and the selection of genetically divergent parents from the available germplasm is necessary. Breeders greatly depend upon the nature and magnitude of genetic variance of the characters under consideration and interrelationship among them before taking up hybridization programme (Savankumar et al., 2018). Crop improvement is possible through exploitation of variability present in the population and understanding heritability of various traits. D2 analysis is a statistical tool which is useful in selecting genetically divergent parents for using in crop improvement programme. This technique also helps in analyzing the genetic diversity among large number of germplasm lines.
The experimental material comprising fifty little millet germpalsm lines which were evaluated at Agricultural Research Station, Perumallapalle, Tirupati during Kharif 2014. Genotypes were raised in randomized block design (RBD) with three replications with a spacing of 22.5 × 7-10 cm. Each genotype was grown in 10 lines of 3 m length. Recommended package of practices were followed to raise healthy crop. Randomly five competitive plants were selected from each replication and observations were recorded for nine quantitative traits viz., plant height (cm), number of productive tillers per plant, flag leaf length (cm), flag leaf width (cm), days to 50% flowering, length of peduncle (cm), length of inflorescence (cm), length of lower raceme (cm) and grain yield per plant (g). Genetic divergence was estimated by following Mahalanobis’s D2 statistics (1936) and clustering of germplasm was done on the basis of D2. values according to Tocher’s method as described by Rao (1952). Statistical analysis was done using WINDOSTATTM programme.
Genetic divergence studies on yield attributes in little millet
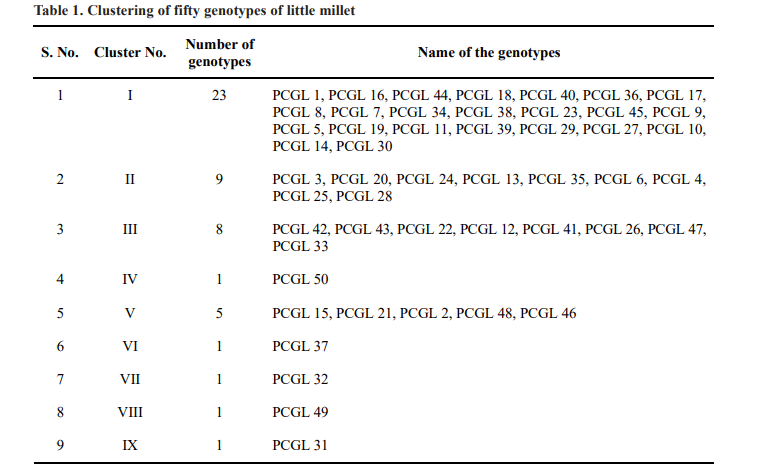
Quantitative assessment of genetic divergence was made by adopting Mahalanobis D2 statistic for yield and its contributing characters in fifty little millet genotypes. The variance due to genotypes was significant for all characters. Hence, further analysis was made to estimate D2 analysis. Fifty genotypes were grouped into nine clusters based on D2 values using Tocher’s method, such that the genotypes belonging to same cluster had an average smaller D2 values than those belonging to different clusters. The distribution of genotypes into various clusters is shown in Table 1. Out of nine clusters, cluster I was the largest comprising of 23 genotypes followed by cluster II had nine genotypes, cluster III had eight genotypes, cluster V had five genotypes and the remaining clusters IV, VI, VII, VIII and IX consisted of one genotype each indicating high degree of heterogeneity among the genotypes.
Intra and inter cluster distances were helpful in the selection of divergent parents for crop improvement
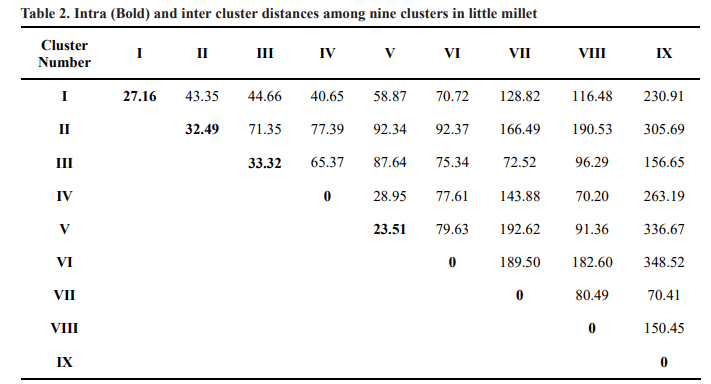
programme. The intra and inter cluster distance values among nine clusters were given in Table 2. Intra cluster average D2 values ranged from 0.00 to 33.32. Among the clusters, cluster III had the maximum intra cluster distance(33.32) followed by cluster II (32.49), cluster I (27.16), cluster V (23.51) indicating the presence of wide genetic diversity among the genotypes present within the same cluster. Similar wide genetic diversity was reported earlier by Venkataratnam et al. (2019) and Suryanarayana and Sekhar (2018). Clusters IV, VI, VII, VIII and IX recorded zero values for intra cluster distance because these clusters possessed only one genotype. The maximum inter cluster D2 value was observed between cluster IX and VI (348.52) followed by between cluster IX and V (336.67), cluster IX and II (305.69), cluster IX and IV (263.19) and cluster IX and I (230.91) which indicated that the genotypes from these clusters would be utilized directly for crop improvement programme to develop heterotic little millet varieties. The maximum amount of heterosis is expected from the crosses with parents belonging to the most
divergent clusters (Kumar et al. 2010).
While the minimum D2 value was found between cluster V and IV (28.95) followed by between cluster IV and I (40.65), cluster II and I (43.35) and cluster III and I (44.66). The study revealed that inter cluster distance was higher than the intra cluster distance which indicated high degree of genetic divergence between the clusters. Genotypes from these clusters could be used as parents in hybridization programme. Similar results were reported
earlier by Arunachalam et al. (2005), Selvi et al. (2015)and Patel et al. (2018) in little millet.
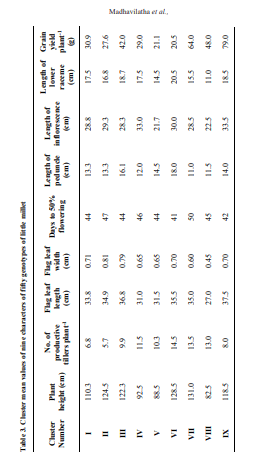
Cluster means for nine quantitative traits were presented in Table 3. The results clearly indicated appreciable difference among cluster means for most of the characters. Early flowering genotype was observed in cluster VI (41 days) and cluster IX (42 days), while delayed flowering genotype was in cluster VII (50 days). Genotype in cluster VI was taller in height (128.50 cm), while genotype in cluster VIII was shorter in height (82.5 cm). Minimum number of productive tillers per plant was observed in cluster II (5.7) and maximum in cluster VI (14.5). Inflorescence length was more in cluster IX (33.5 cm) and less in cluster V (21.7 cm). Flag leaf length was maximum in cluster IX (37.5 cm) and lowest in cluster VIII (27.0 cm). Genotype in cluster IX recorded high grain yield per plant (79 g) while genotype of cluster VI showedlow grain yield per plant (20.5 g).
Cluster means for nine quantitative traits were presented in Table 3. The results clearly indicated appreciable difference among cluster means for most of the characters. Early flowering genotype was observed in cluster VI (41 days) and cluster IX (42 days), while delayed flowering genotype was in cluster VII (50 days). Genotype in cluster VI was taller in height (128.50 cm), while genotype in cluster VIII was shorter in height (82.5 cm). Minimum number of productive tillers per plant was observed in cluster II (5.7) and maximum in cluster VI(14.5). Inflorescence length was more in cluster IX (33.5 cm) and less in cluster V (21.7 cm). Flag leaf length was maximum in cluster IX (37.5 cm) and lowest in cluster VIII (27.0 cm). Genotype in cluster IX recorded high grain yield per plant (79 g) while genotype of cluster VI showed low grain yield per plant (20.5 g).
High yielding genotype, PCGL 31 of cluster IX can be utilised in crop improvement programme. Similarly the genotype PCGL 37 of cluster VI recorded early flowering which could be used as diverse sources in future breeding programme to develop early maturing varieties. Dwarf genotype, PCGL 49 can be utilized for developing non lodging dwarf little millet varieties. The results depicted the presence of sufficient genetic diversity among little millet accessions for further use in breeding programme. The genotypes identified to be highly diverse in the present study could be exploited in future breeding programs of little millet.
Anonymous, 2018. Annual Report, ICAR-AICRP on small millets, Bengaluru. Arunachalam, V., Rengalakshmi, R and Raj, M.S.K. 2005.
Ecological stability of genetic diversity among landraces of little millet (Panicum sumatrense) in South India. Genetic Resources and Crop Evolution.
52(1): 15-19.
Kumar, D., Tyagi, V., Ramesh, B and Pal, S. 2010. Genetic Diversity in Finger Millet (Eleusine coracana L.). Crop Improvement. 37: 25-28.
Mahalanobis, P.C. 1936. On the Generalised Distance in Statistics. Proc. Nat. Inst. Sci., India. 2: 49-55.
Nirmalakumari, A., Salini, K and Veerabadhiran. P. 2010. Morphological Characterization and Evaluation of Little millet (Panicum sumatrense Roth. ex. Roem. and Schultz.) Germplasm. Electronic Journal of Plant Breeding. 1(2): 148-155.
Patel, S.N., Patil, H.E., Patel, S.P and Patel, U.M. 2018. Genetic diversity study in relation to yield and quality traits in little millet (Panicum miliare L.). International Journal of Current Microbiology and Applied Sciences. 7 (6): 2702-2711.
Rao, C.R. 1952. Advanced Statistical Methods in Biometrical Research. John Willey and Sons Inc., New York., 357-363.
Savankumar, N., Patel., Harshal E., Patil., S.P and Patel, U.M. 2018. Genetic Diversity Study in Relation to
Yield and Quality Traits in Little Millet (Panicum miliare L.). International Journal of Current Microbiology and Applied Sciences 7(6): 2702-2711.
Selvi, V.M., Nirmalakumari, A and Subramanian, A. 2015. Assessment of genetic diversity using morphometric
traits in little millet (Panicum sumatrense). Trends in Biosciences. 8(1): 119-125. Suryanarayana, L and Sekhar, D. 2018. Genetic divergence studies in little millet (Panicum sumatrense L.). The Pharma Innovation Journal. 7(7):944-945.
Venkataratnam, T., Madhavilatha, L., Sekhar, M.R and Kumar, A.R.N. 2019. Genetic Divergence Studies in Little Millet (Panicum sumatrense). Agricultural Science Digest. 39(3): 210-214.