
0 Views
Institute of Agribusiness Management, S.V. Agricultural College, ANGRAU, Tirupati.
In Telangana’s Rangareddy district, research was conducted to explore the maize supply chain. Six villages were selected
for the present study from which sixty farmers and ten market intermediaries were polled to discover more about the maize supply chain’s existing routes and their effectiveness for marketing. There were four significant supply chain pathways in the study area. 46.67 per cent of the farmers have chosen supply chain I among the four supply chains. Channel I has the lowest marketing expense per quintal of maize among the four marketing channels, followed by Channel II, Channel III, and Channel IV. The marketing expenses per quintal of maize sold through the above channels were 100.20, 128.04, 231.27 and 259.11 rupees respectively. Acharya’s method suggested that channel I (15.21) was efficient than channel II (11.47), channel III (5.38), and channel IV (4.77).
KEYWORDS: Maize, Marketing cost, Marketing efficiency, Supply chain channels
Maize is one of the world’s most adaptable crop. It is grown in the tropics, subtropics, and temperate regions up to 500 to 4000 meters above sea level in all semi-arid, irrigated conditions. Maize has a broad range of applications due to its global distribution and lower price. It is used not only for direct human consumption, industrially processed food and livestock feed but also in non-food industrial items such as starches, acids, and alcohols. Recently been a renewed interest in using maize to make ethanol as a substitute for petroleum- based fuels.
As maize has the highest genetic yield potential among the cereals, it is known as the “Queen of Cereals” globally (Balvant and Gangadevi, 2018). With a mean yield of 5.75 MT ha-1, more than 170 countries are currently producing 1147 000 MT of maize on a 193 000 ha field (FAOSTAT, 2020).
In India, maize crop is grown in a wide range of 9200 ha with a yield of 27200 MT (FAOSTAT, 2020). With 3730 MT, Karnataka produces the most maize, followed by Madhya Pradesh and Bihar. The most productive state is Tamil Nadu, with Andhra Pradesh and West Bengal following closely behind it (6551 kg ha-1).The foremost crop produced in Telangana is maize (corn), which is grown on roughly 14 lakh acres and yields 16 lakh tonnes yearly. Siddipet, Nagarkurnool, Rangareddy, Vikarabad, Mehaboobnagar, Kamareddy, Nizamabad, Karimnagar, and Jagtial are notable districts in Telangana for producing maize, responsible for about 85 per cent of the state’s total production.
An efficient network of agricultural marketing system is a vital link between farmers and consumers (Jaisridhar et al., 2012). Net price received by the farmers depends on the efficiency of the marketing channel. Hence, the present study was undertaken with the objectives of understanding the existing marketing channels of maize, price spread of maize and examine the efficiency of various supply chains in the study area.
Area under maize cultivation is being increasing for the past decade due to increase in its usage as poultry feed in Rangareddy district of Telangana and hence, Rangareddy district was purposely selected for the study. Two mandals namely Nandigama and Kothur from Rangareddy district where maize was majorly grown were chosen for the study. Appareddyguda, Cheguru, Majid Mamidpally villages from Nandigama mandal and Kodicherla, Penjerla, Manchanpadu villages from Kothur mandal were selected randomly for the study. Ten farmers from each village were selected randomly, thus the total sample size of farmers constitutes 60 farmers. The primary data was collected from farmers through personal interview method by using a schedule. The primary data pertain to the year 2020-2021. Descriptive analysis in this study was performed by employing tabular analysis technique. The producer’s price is the net price received by the farmer at the time of first sale. This is equal to the wholesale price at the primary assembling center, minus the charges borne by the framers in selling.
Pf = PA – Cf
where,
PA= is the price received by the farmer
Cf = is the marketing cost incurred by farmer Pf = is the producer’s price
Marketing efficiency for the identified supply chain
channels can be measured by using three methods.
Efficiency of any activity or process is defined as the ratio of output to input. If ‘O’ and ‘I’ are respectively output and input of the marketing system and ‘E’ is the index of marketing efficiency, then
E = O ÷ I × 100
A higher value of E denotes higher level of efficiency and vice versa. When applied in the area of marketing, output is the ‘value added’ by the marketing system and ‘input is the real cost of marketing (including some fair margins of intermediaries)’
Shepherd suggested that the ratio of the total value of goods marketed to the marketing cost may be used as a measure of marketing efficiency. The higher the ratio, the higher efficiency and vice versa. This method eliminates the problem of measurement of value added.
This is said to be the efficient method in measuring marketing efficiency. According to Acharya and Agrawal (1992) marketing efficiency is the ratio of net price received by the farmer to the total marketing cost plus total marketing efficiency.
MME = FP ÷ (MC + MM) X 100.
where,
MME : Modified measure of marketing efficiency
FP : Price received by the farmer MC : Total marketing costs
MM : Total marketing margins
The concurrent margin has been estimated, as it is the difference between the prices prevailing at successive stages of marketing at a given point of time, e.g., the difference between farmers’s selling price and retail price on a specific date is the total concurrent margin. To study the existing marketing system, marketing margins and cost for different channels in the selected markets and the price spread was estimated by using the following formulae.
Market Margin of ith middlemen (Ami)
where,
Ami = Market margin of ith middlemen
Pri = Total value of receipts per unit (Sale price)
Ppi = Purchase value per unit (Purchase price)
Cmi = Cost incurred on marketing per unit by the ith middlemen Total marketing cost
C = Cf + Cm1 = Cm2 + Cm3 +……. + Cmn
where,
C = Total cost of marketing of the commodity
CF = Cost paid by the producer from the time the
produce leaves the farm till he sells it
Cmn = Cost incurred by the nth middlemen in the process of buying and selling the produce.
The socio-economic characteristics of the respondents reveal understanding of the sample’s age, literacy level, landholding, and experience of the farmers as well as other supply chain stakeholders.
A perusal of Table 1 detailed that larger proportion of sample farmers and market middlemen were of middle aged which was 56.67 per cent and 60 per cent respectively. About 38.33 and 40 per cent of sample farmers and market middlemen completed their secondary school education. Most of the farmers in the sample were medium farmers (46.66%) followed by small farmers (26.67%), large farmers (16.67%) and marginal farmers (10.00%). About 43.33 per cent of the sample farmers were cultivating maize in less than one hectare of land. 31.67 per cent, 21.67 per cent and 3.33 per cent were cultivating maize in 1 to 2 hectares, 2 to 10 hectares and
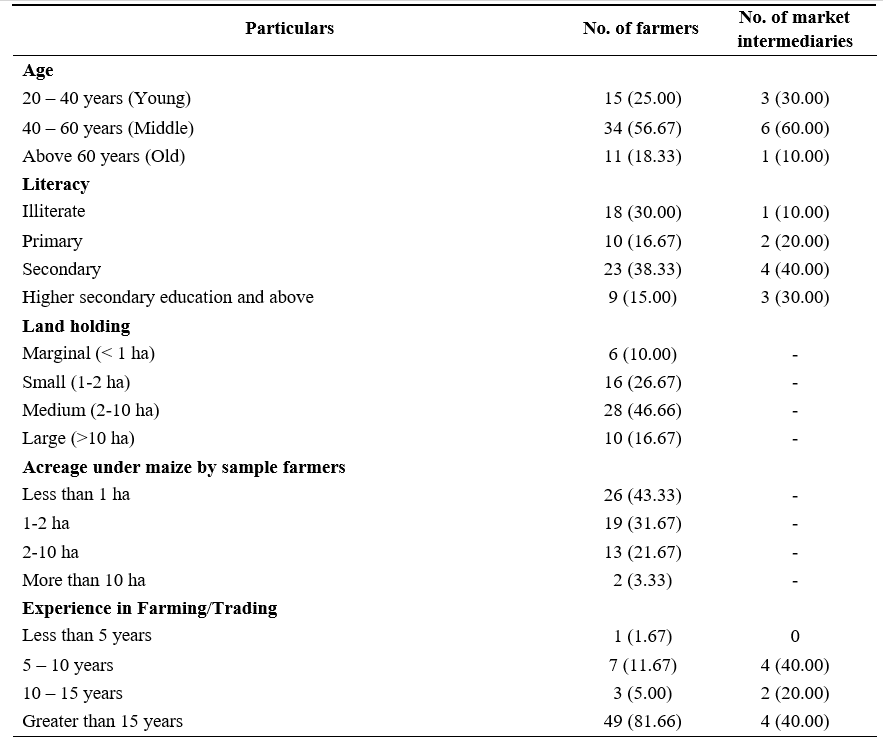
more than 10 hectares of land respectively. From the results it was found that, about 81.66 per cent of farmers had more than 15 years of farming experience, 11.67 per cent had 5-10 years of experience, 5 per cent had 10-15 years of experience and 1.67 per cent of farmers had less than 5 years of farming experience. Further 40 per cent of market intermediaries had more than 15 years of trading experience as well as 5-10 years experience followed by and 20 per cent had 10 – 15 years of experience and 40 per cent had 5-10 years of experience.
Four supply chain channels of maize were identified in Rangareddy district of Telangana State. The identified channels were
Channel – I : Producer – Hatcheries
Channel – II : Producer – Commission agent –
Hatcheries
Channel – III : Producer – Wholesaler – Hatcheries Channel – IV : Producer – Commission agent –
Wholesalers – Hatcheries
Among the four channels enlisted above, channel I was the shortest channel. As there were no intermediaries in the channel, this channel stood as most efficient among all the channels. When the producer was unable to sell the produce directly to the end customer i.e., hatcheries, then he took the help of commission agents in the village.
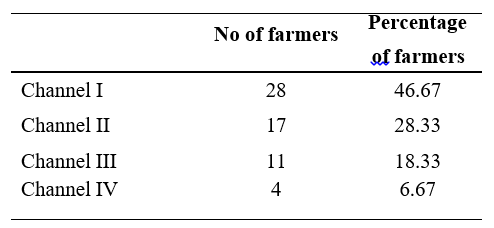
This constituted as channel II. This channel would be preferred by the producer when the market is nearer. Channel III also constituted three stakeholders. The produce went to wholesaler and the wholesaler sold it to the end customer i.e., hatcheries. The producer preferred selling to wholesaler as the wholesaler would be helpful to the producer in terms of weighing, transport and also financial help when required. Channel IV was constituted with four stakeholders. The produce first go to the village level commission agent then to wholesalers and finally to hatcheries. Among the four channels listed above, 46.47 per cent of farmers followed channel I, 28.33 per cent followed channel II, 18.33 per cent followed channel III and only 6.67 per cent followed channel IV (Table 2).
supply chains
Marketing cost and margin of maize at producer level was varied according to selected market, method of sale, quantity of marketed surplus, distance from production point to market and type of storage materials (Srikanth et al., 2017).
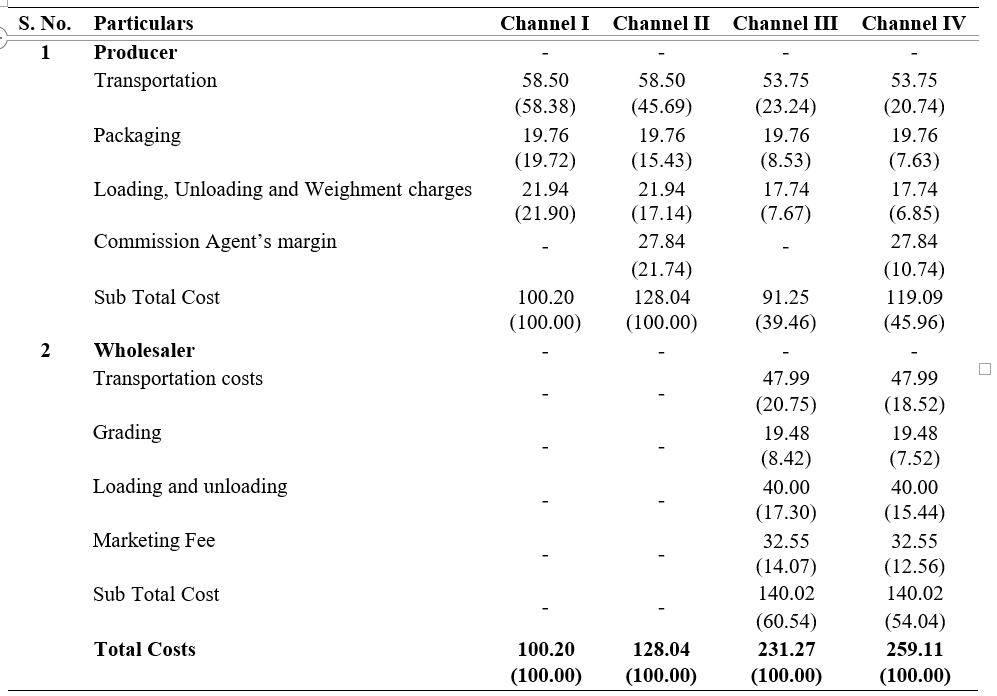
Among the four marketing channels, Channel I has the least marketing cost per quintal of maize followed by Channel II, Channel III and Channel IV. The respective marketing costs per quintal of maize in the above market channels determined out to be 100.20, 128.04, 231.27 and 259.11 rupees respectively. (Table 3)
In marketing channel I, entire marketing costs were borne by the producer alone. An amount of ` 58.50 (58.38%) was incurred on transportation of maize from villages to the hatcheries, packaging expenditure was ` 19.76 (19.72%) and loading, unloading and weighment charges was ` 21.94 (21.90%) per quintal. Hence sum of marketing cost incurred by the producer which is also the total marketing cost of the channel was `100.20 per quintal. In marketing channel II, commission agent helps the producer to move the product from producer to hatcheries. In this channel in addition to the
cost born by the wholesaler is ` 140.02 (54.04%) and it includes transportation charges from wholesale market to hatcheries ` 47.29 (18.52%), costs for grading and packing ` 19.48 (7.52%), loading and unloading charges ` 40.00 (15.44%) and marketing fee ` 32.55 (12.56%). Thus the total marketing cost of the supply chain IV was ` 259.11.
In supply chain I and II the entire marketing cost was born by the farmer alone. In supply chain III and IV 39.46 and 45.96 per cent of the marketing cost was paid by the farmer respectively. In all the supply chains transportation costs was the major component in the total marketing cost. Balvant Pagi and Gangadevi (2018) also reported that transportation cost occupied a major portion in marketing of maize, in tribal areas of middle Gujarat.
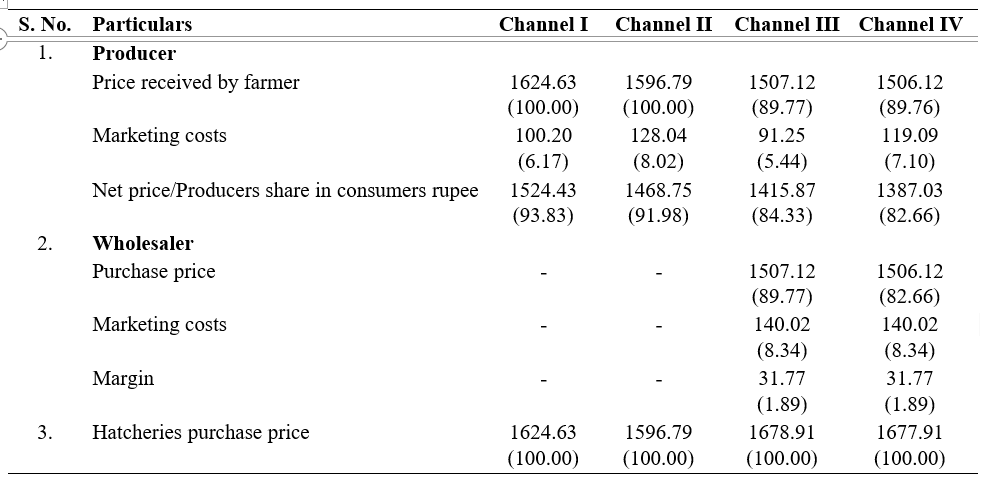
Marketing costs and marketing margins of the identified supply chains were calculated to assess the share of different agencies involved in the supply chain along with producers share in consumers rupee are shown in Table 4. Producers share in consumer rupee varied from one channel to another channel depending upon the marketing agencies involved. Producers share in consumers rupee was highest (93.83%) in channel I. The same was 91.98 per cent, 84.3
in channel II, channel III and channel IV respectively. In marketing channel I the producers directly sells his produce to the hatcheries and hence incur ` 100.20 per quintal of produce towards marketing cost. and received a net price of ` 1524.43. In marketing channel II the producer takes the help of commission agent to sell his produce to hatcheries, hence the marketing cost incurred was ` 128.04 per quintal of produce. Farmer received a net price of ` 1468.75. In marketing channel III the producers sells his produce to wholesaler. The marketing costs incurred by the producer was ` 91.25 per quintal of maize and the net price received by the farmer was
` 1415.87. The wholesaler incurred ` 140.02 towards marketing costs and ` 31.77 towards marketing margin. The margin realized by the wholesaler was 1.89 per cent of consumers rupee. In marketing channel IV both commission agent and wholesaler involves in marketing of the produce. The marketing costs incurred by the farmer was ` 119.09 which was 7.10 per cent of the consumers rupee. The net price realized by the farmer was ` 1387.03 per quintal of maize. The marketing cost and margins enjoyed by the wholesaler was ` 140.02 and ` 31.77 respectively.
From the results it was noticed that there was a huge difference in price spread of channels where there was no intervention of market intermediaries and the channels with market intermediaries. Similar results also reported by Chauhan and Kumar (2010).
Marketing efficiency of identified supply chains of maize were estimated using Conventional, Shepherd, and Acharya’s Approach. Marketing efficiency in identified supply chains is presented in Table 5. Conventional method suggest that channel III (1.14) was more efficient than channel IV (1.12), channel II (1.00), and channel I (1.00). But in this channel producers share in consumers rupee was less in this channel. Hence this channel was
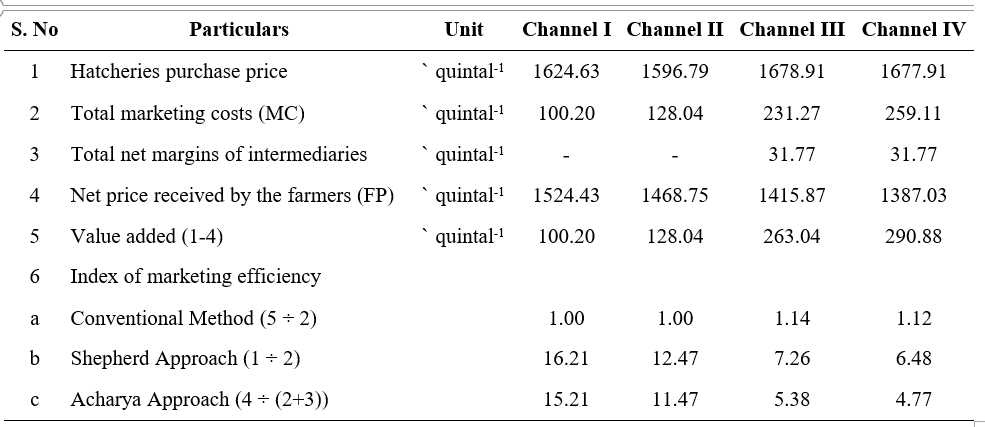
not suggestive if maximization of farmers share is the objective.
Shepherd’s method suggest that channel I (16.21) was more efficient than channel II (12.47), channel III (7.26), and channel IV (6.48). Acharya’s method also suggest that channel I (15.21) was more efficient than channel II (11.47), channel III (5.38), and channel IV (4.77).
From the results above, it was concluded that channel I was more efficient than the other marketing channels as the farmers are directly selling their produce to hatcheries. Most of the farmers who are having good quality of produce and not depending on market intermediaries for capital requirement were selling their produce directly to hatcheries. Those farmers who were depending on marketing intermediaries for their capital requirement for raising the maize crop were approaching marketing channels II, III, and IV. Kumar and Chahal (2011) also observed the highest marketing efficiency in the channel where no market intermediaries involved.
Transportation places a very important role in marketing of maize, a well developed transportation system reduces the transportation cost and increases the efficiency of the marketing system. Credit facilities should be made available to the farmers so that their dependency on market intermediaries can be reduced. Establishing Farmers Producers Organizations can eliminate the involvement of market intermediaries, and increases the price received by the farmers.
Acharya S.S and Agarwal, N.L. 1992. Agricultural marketing in India. Oxford & IBH Publishing Co. Pvt. Ltd., New Delhi.
Chauhan, S.K and Kumar, S. 2010. Production, marketed surplus and post harvest lossed in maize crop of India. Indian Journal of Agricultural Marketing. 24(2): 29-40.
FAOSTAT. 2020. Food and Agriculture Organization of the United Nations. https://www.fao.org.
Jaisridhar, P., Ravichandran, V., Jadoun, Y.S and Senthil, R. 2011. Study on adoption and marketing behaviour of maize grower in Coimbatore district of Tamil Nadu. Indian Journal of Agricultural Research. 46(2): 173-177.
Kumar, R and Chahal, S.S. 2011. An economic analysis of maize marketing in Punjab. International Research Journal of Agricultural Economics and Statistics. 2(1): 79-86.
Srikanth, B., Kausadikar, H. H., Jondhale, R.N and Gandhi, N. 2017. Economic Analysis of maize production and marketing in Khammam district, Telangana. Asian Journal of Agricultural Extension, Economics and Sociology. 20(4): 1-13.
Balvant, P and Gangadevi. 2018. Economics and marketing of maize growers in tribal area of middle Gujarat. Indian Journal of Agricultural Marketing. 24(2): 29-40.