
0 Views
Institute of Agri-Business Management, S.V. Agricultural College, ANGRAU, Tirupati-517 502.
Onion (Allium cepa) is a popular and widely cultivated vegetable crop worldwide. It belongs to the Allium genus, which
also includes garlic, leeks, and chives. Onions are known for their pungent flavour and distinctive aroma, making them a staple ingredient in many cuisines. Onions are cool-season crops and can be grown in a wide range of climates. They prefer well-drained, sandy-loam soil with a pH between 6.0 and 7.5. They require full sunlight, but they can tolerate partial shade. The ideal temperature for onion growth is between 55°F and 75°F (13°C to 24°C). There are numerous onion varieties, ranging in size, shape, and colour. Common types include yellow or brown onions, red onions, and white onions. They are a versatile and essential vegetable in the culinary world, adding flavour to a wide range of dishes. Their cultivation is practiced globally, both on a small scale for home gardening and on a large scale for commercial production. Understanding the price behaviour of onions in Kurnool district is vital for various stakeholders, including farmers, traders, policymakers, and consumers. This study aims to contribute valuable insights to the agricultural community, policymakers, and researchers. Furthermore, the findings of this research will aid in devising strategies to ensure a stable and sustainable onion market that benefits all stakeholders involved. To understand the price patterns and trends of onions in the Kurnool district, time series analysis was applied. Secondary data was used for studying the price behaviour and price trends in onion crop. This analytical approach helped identify fluctuations and changes in onion prices over time. A regression analysis was conducted on onion price data in selected markets to study the long-term fluctuations. Among these markets, the Kurnool market showed the lowest annual increase in prices, which amounted to 3.65 Rs/qt. This finding was statistically significant at a 1% level of significance. Within the Kurnool market, the month of August exhibited the highest seasonal index, reaching a value of 127.104. February and November had slightly lower seasonal indices, standing at 123.061 and 120.825, respectively. On the other hand, the lowest seasonal index of 59.15 was observed in May. This decline during the mentioned period was attributed to the arrival of rabi onions, known for their longer shelf life compared to the Kharif onion crop. However, despite the fluctuations, no distinct price cycles were detected for the onion crop in the chosen market. The irregular fluctuations in the Kurnool market did not exhibit any specific pattern or periodicity in their occurrence.
KEYWORDS:
Onion is being cultivated in Andhra Pradesh over an area of 44,600 hectares with a yield of 16.2 tons per hectare, slightly lower than the national average of 18.64 tons per hectare. Kurnool district leads in both area and production in the state. The farmers in Kurnool district prefer traditional local varieties for the Kharif season due to a lack of awareness about improved high-yielding varieties. This results in poor yields and low net returns. To address this issue, there is a need to educate farmers about the latest suitable varieties for Kharif and promote their adoption to increase production, productivity, and net income. India’s onion production is highly influenced by rainfall, making the crop susceptible to climatic changes. Additionally, onion prices in India are often volatile due to supply-demand imbalances, transportation bottlenecks, and inadequate storage facilities. In 2022, Kurnool District experienced fluctuating onion prices, with wholesale prices dropping to Rs. 4 per kg in the agriculture market yard. This was attributed to a good harvest and low demand, exacerbated by incessant rains that damaged onion crops in several acres. Traders were reluctant to offer higher prices for the low-quality onions, with prices ranging from Rs. 400 to Rs. 420 per quintal, causing distress to the farmers who couldn’t meet the Minimum Support Price of Rs. 770 announced by the State Government. This study aims to contribute valuable insights to the agricultural community, policymakers, and researchers. Furthermore, the findings of this research will aid in devising strategies to ensure a stable and sustainable onion market that benefits all stakeholders involved.
Time series analysis was used to identify the patterns and trends in the price behaviour of onion in Kurnool district. Secondary data was used for studying the price behaviour and price trends in onion crop. The data was collected from registers maintained by the respective market committees, NHRDF (National Horticulture Research and Development Foundation). The time series data on monthly prices of onion for the period of 15 years from 2008 to 2022 required for the study was collected from the registers maintained by the Agriculture Produce Market Committees (APMCs), AGMARKNET and NHRDF.
Time series analysis: A time series is a set of observations taken at specified times, usually at equal intervals. The intervening period may be an hour, day, week, month, season or year. Database for time series analysis in the present study was the data on monthly prices from 2008 to 2022 in chronological order. Analysis of time series data on prices is of great importance.
The major time elements or components of time series have been identified as i) secular/long term/ trend component (Tt) ii) seasonal variation/periodic movements (St) iii) cyclical movements (Ct) and iv) irregular movements (It).
Secular / trend component: The tendency of prices to move up or down over a longer period of time is termed as trend. The factors responsible for such changes in time series are the growth of population, change in the tastes of people, technological advances in the field etc.
Seasonal variation/periodic movements: The variation within a year is called as seasonal variation. Among the components of time series, seasonal variations cause the movements of the data very frequently which recur more or less regularly in the same months of successive years. The main cause of seasonal variations are customs, climate etc.
Cyclical movements (Ct): A cycle is defined as a regularly occurring phenomenon. When this phenomenon occurs in movement of prices, it is termed as price cycle. Cyclical variation is an oscillatory movement in a time series where the period of oscillation happens to be of more than one year. Oscillating movement of less than one year periodicity is termed as seasonal variation. Generally, the cyclical movements take the form of a wave with an uneven length (intervening period between one peak and the next or between one trough and the next) and amplitude (extent of upswings and downswings) because of complex combination of forces affecting the equilibrium of demand and supply.
Irregular variations (It): Irregular or episodic price movements represent that part of the behaviour of prices which is not systematic. A particular price movement may not recur in the future. No generalizations can be made about such price fluctuations because of the diversity in their nature and irregularity of the cause-and- effect relationship in their occurrence. They may be of short or longer duration.
The examination of a time series involves studying of its different elements and their characteristics. There are four components in the time series, namely trend, cyclical, seasonal, irregular and these components are interconnected in a multiplicative manner.
This section focused on segregating these elements from a monthly pricing data of onion crop in Kurnool market. A complete understanding on price helps in making informed decisions which helps in shaping agricultural policies.
Examining the trend component in a monthly price series involves determining the overall trajectory of price fluctuations over a specific duration. Typically, the trend was represented by a linear expression. To determine the long-term fluctuations of onion prices in the chosen markets, the price data of onions were analysed using regression analysis.
The findings reported in the Table 1, indicated a notable upward trend in onion prices in the Kurnool market. These trends were observed to be statistically significant. The annual price increment at the Kurnool market was low. (3.65 Rs/qt). It was found to be statistically significant at 1% level of significance.

To analyse the seasonal fluctuations in onion prices within specific markets, seasonal indices were calculated using the 12-month moving average approach. The computed seasonal indices for monthly prices in the chosen markets were shown in Table 2.
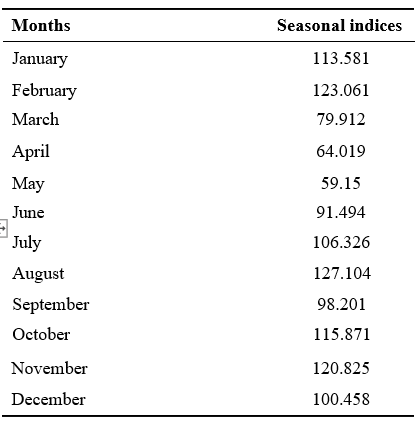
From the results it was found that in Kurnool market, August month had the highest seasonal index, with a value of 127.104, while February and November followed closely behind at 123.061 and 120.825 respectively. Conversely, the lowest seasonal index was observed in May measuring 59.15. In Kurnool, the market witnesses the commencement of the early kharif crop’s arrival in the August month. Subsequently, the market experiences the entry of the late kharif crop in the months of October and November. It was evident from the table that highest seasonal indices for onion prices were recorded during the months of August, November, October and February at the Kurnool market. Conversely, the lowest seasonal indices were observed in the months of March, April and May.
The Table 3, displayed the outcomes of cyclical fluctuations in onion prices in Kurnool market. The analysis revealed that there were no instances of price cycles detected in chosen market.
Following Table 3, presented the non-systematic changes in onion prices in selected markets, while following figures visually illustrated these variations. The data in the table clearly indicated that the irregular
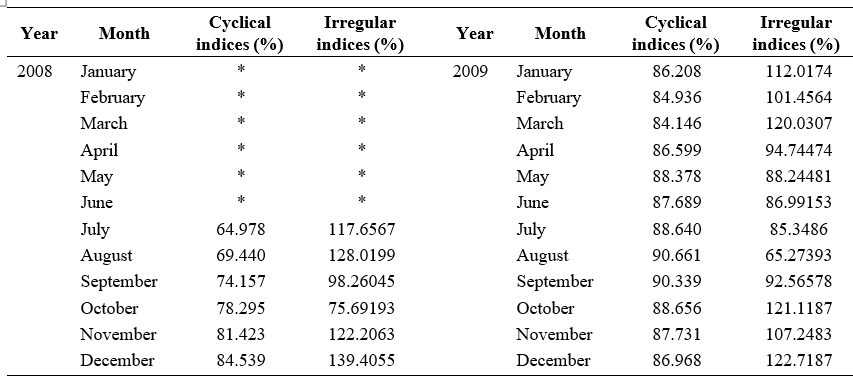
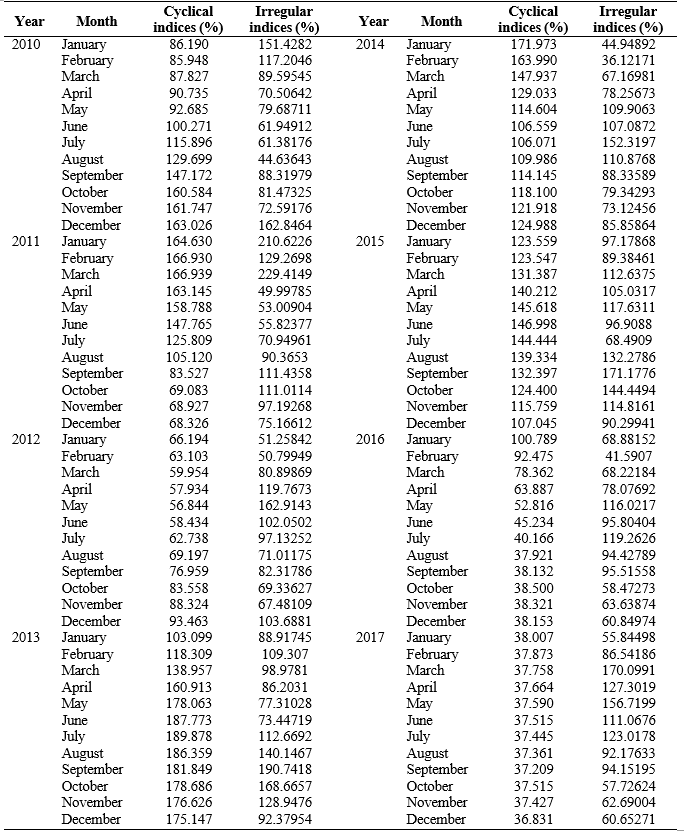
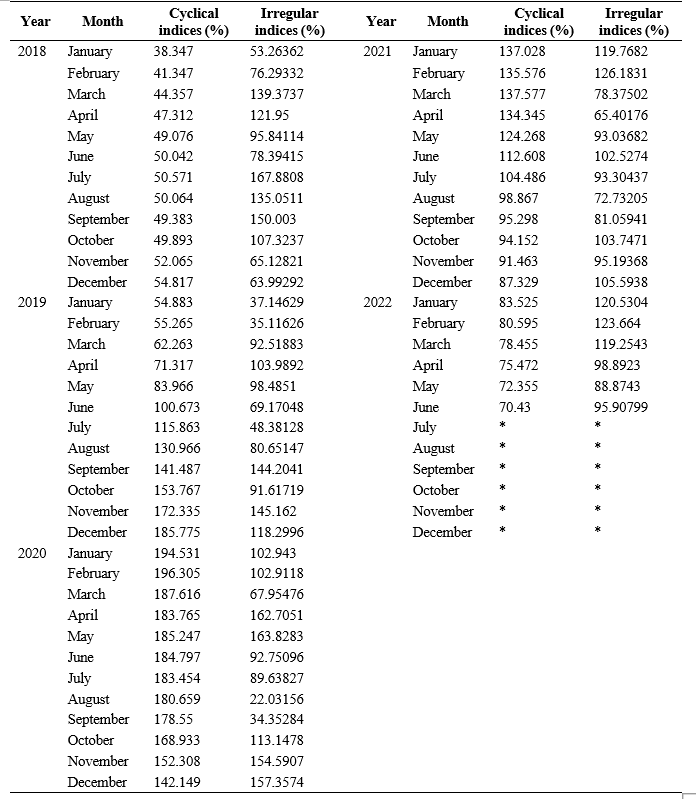
fluctuations in Kurnool market do not display any specific pattern or periodicity in their occurrence.
In conclusion, studying the price behaviour of onions is essential for various stakeholders in the agricultural and food sectors. Understanding the underlying factors that influence onion prices can aid policymakers, farmers, traders, and consumers in making informed decisions, promoting stability in the market, and ensuring a steady and affordable supply of onions.
Ahmed, M and Singla, N. 2017. Market integration and price transmission in major onion markets of India. Economic Affairs, 6(3): 405-417.
Amand R and Gummagolmath K.C. 2020. Temporal Analysis of onion prices in major Markets in India. Journal of Agricultural Extension Management, 19(2): 76- 92.
Diwaker, N.S and Rai, J. 2014. An economic study of behaviour of market arrivals and prices of onion, garlic and turmeric in selected markets of Utter Pradesh, India. International Research Journal of Agricultural Economics and Statistics. 5(2): 235-240.
Hemanth, S. 2013. Market intelligence with reference to price behaviour of major food grains in Rajasthan. Ph.D. Thesis, Maharana Pratap University of Agriculture and Technology, Udaipur, Rajasthan, India.
Mulla, A., Seelam, R., Vani, A and Naidu, G.M. 2020. Price behaviour and forecasting of onion prices in Kurnool market, Andhra Pradesh state. Economic Affairs. 65(1): 43-50.
Saxena, R and Chand, R. 2017. Understanding the recurring onion price shocks: Revelations from production–trade–price linkages. Policy paper No. 33, ICAR-National Institute of Agricultural Economics and Policy.
Sharma, P., Gunmagolmath, K.C and Sharma, R.C. 2011. Prices of onion: An analysis. Economic and Political Weekly, 56(2): 22-25.