
0 Views
Institute of Agribusiness Management, S.V. Agriculture College, ANGRAU, Tirupati-517502.
In this rapidly developing economy, the agricultural marketing plays a pivotal role in providing the lucrative prices and
financial prosperity of the rural economy. FPOs provide access to markets by establishing the effective linkage between the producers and the retailers by streamlining the marketing channel. Kurnool district consists of actively performing FPOs under different departments and was purposively selected as there is a good spread of crops across the mandals and potential scope exists for setting up of multi commodity FPOs in the district. Multi staged stratified random sampling technique is adopted. The sample size constitutes of 100 FPO members and 50 Non FPO members in the study area. The current study was deliberated to analyse the prospects of the marketing channels adopted by the FPO and Non-FPO members. Marketing channel 1 is followed by FPO members while Channel II is followed by non FPO members. Price spread analysis of the current study reveals, the price spread in marketing channel I is relatively less compared to the channel II due the decreased length of the marketing channel of FPO farmers. Producer’s share in the consumers’ rupee received by the FPO farmers is more than the Non-FPO farmers which accounted to 88.96 per cent in the Channel I which was higher compared to Channel II accounted to 85.41 per cent in the cotton marketing, Like wise in the groundnut marketing, it accounted for 82.71 per cent for channel I and 77.86 per cent for channel II and in redgram marketing, it accounted for 78.40 per cent in the channel I and 70.19 per cent in the channel II in the study area. This difference is due to reduction in the transaction costs and the market margins in the channel I.
KEYWORDS: Market, marketing channels, Price spread, Producer share in consumer rupee.
Farmer producer organizations aim to assure good income for the farmers through the organisation of their own. Small farmers do not have the volume individually (both farming inputs and yield) to reap the benefit of economies of scale. Farmers are the shareholders of a producer organization (PO) where investments are catalysed by the state or donor agencies. FPOs are acclaimed as institutions that can increase the skills, farm income and bargaining power of the smallholder farmers in the production and marketing of the produce.
The majority of the POs benefit their members by reducing their transaction costs, generating employment opportunities, instant revenue payments, capacity building etc., (Singh, 2017). Producer organizations has the potential toward doubling the farm income.
In marketing of agriculture commodities involvement of more number of intermediaries is noticed where the farmer takes only a minimal part of the value the final consumer pays. FPOs has the scope to enhance access to the markets to its members that help them to obtain the realized prices of their produce and capture huge profits. In view of this, an in-depth study on farmer’s access to markets through FPOs in Kurnool District of Andhra Pradesh was taken up with the following objective.
FPOs are found functioning actively in the state of Andhra Pradesh. At present a total of 852 FPOs have been formed in the state (apagrisnet.gov.in). Kurnool district has 61 actively performing FPOs functioning under different departments. Among actively functioning FPOs, 5 FPOs were purposively selected that is one from each of NABARD, SERP, APDMP, Department of Horticulture and NGO based on the maximum number of members. All the farmers registered under the selected FPOs were listed out and 20 farmers from each of the FPO were selected randomly, thus constituting a representative sample of 100 farmers from 5 FPOs in the study area. A sample of 50 non FPO farmers was also selected randomly for comparison in the study area. The information related to the present study was collected using a well-defined and pre-tested schedule through personal interview method. Detailed information was collected and the information pertained to the agricultural
year 2020-21. Price spread was worked out by taking the difference between the price paid by the consumer and the price received by the producer per quintal of groundnut, cotton and redgram. Producer’s share in the consumer’s rupee is the price received by the producer expressed as a percentage in the consumer’s price.
![]()
Producer ® Village merchant ® Processor Retailer ® Consumer
Marketing channel I is followed by FPO members while Channel II is followed by non FPO members
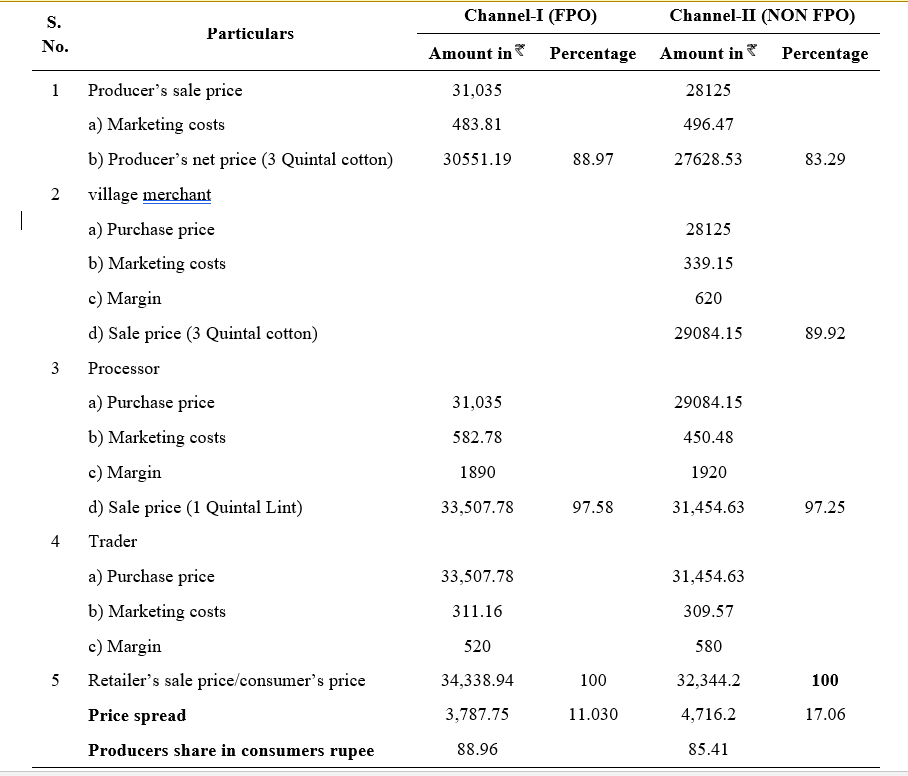
The price spread for both the marketing channels of the cotton was analyzed and presented in a Table 1. The figures in Table 1, depicts that the producers share in the consumer’s rupee was higher which accounted to 88.96 per cent in the Channel I adopted by the FPO members compared to Channel II which is 85.41 per cent.
The producer’s net price was ` 30,551.19 for three quintals of cotton as three quintals of cotton yield one quintal of lint, whereas the producers net price in the channel II was ` 27628.5. The marketing costs beared by the producer was ` 483.81 which was less compared to the producer of Channel II i.e. non FPO member. This is because, as FPO members market their produce collectively to processor the marketing cost becomes relatively less compared to the producer of channel II.
The village merchant was not involved in channel I as the FPO members collectively marketed their produce to the processor taking advantage of collective bargaining power. The purchase price of the cotton by village merchant was ` 28,125 and the marketing cost and marketing margins comprises of about ` 339.15 and 620 respectively.
The producer in channel I directly sold the cotton to the processor where in the processor converts 3 quintals of cotton into one quintal of lint. The purchase price of cotton by the processor in channel I and channel II were` 31,035 and ` 29,084 marketing costs and accounted for
` 582.78 and 450.48 and marketing costs and marketing margins were ` 1890 and ` 1920 of channel I and II respectively.
The retailers purchase price was ` 33,507.78 and 31,454.60 in channel I and channel II respectively and the marketing costs were ` 311.16 and 309.57, and marketing margins were ` 520 and ` 580 in channel I and II respectively. The retailers sale price or the consumer purchase price of channel I and II were ` 34,072.94 and` 32,064.20 respectively
The price spread was found lesser in channel I compared to channel II which was ` 3787.75(11.04%) of consumers purchase price and ` 4716.20 (17.06%) of consumers purchase price of channel II which clearly depicting that producer had gained higher price and higher contribution in consumers price in channel I compared to channel II adopted by the non FPO members.
Producer ® Trader ® Retailer ® Consumer
Producer ® Trader ® Wholesaler ® Retailer ® Consumer
From the two marketing channels mentioned above, Channel I was adopted by the FPO members in the study area and the non FPO members market their produce through Channel II.
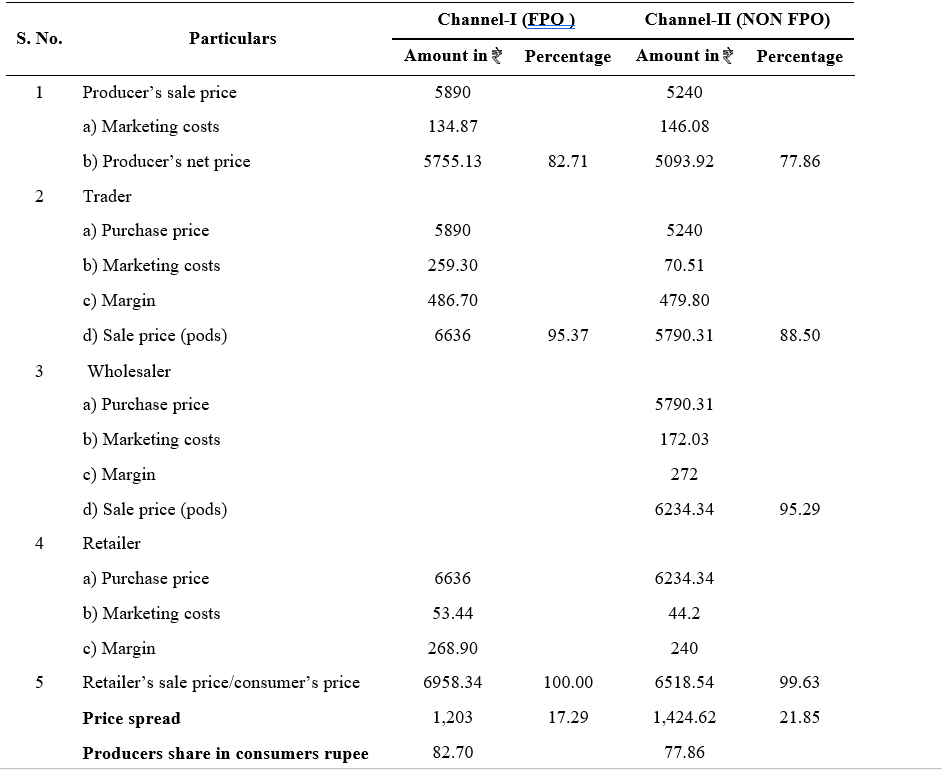
The price spread for two marketing channels was analysed and depicted in the Table 2. The figures in Table 2 depicts that the producers share in consumer’s rupee for the marketing channel I and II was 82.71 per cent for FPO members and 77.86 per cent for non FPO members. The price spread was lower in the marketing channel I compared to the channel II which was ` 1203 (17.29 %) and ` 1424.62 (21.85%) respectively
The sale price of the groundnut pods by producer in the channel I was ` 5890 where as in the channel II the producer sale price was ` 5240. The marketing costs incurred by the producers of the channel I and channel II are ` 134.87 and 146.08 respectively. And the producers net price in the channel I and II was ` 5755.13 and ` 5093.92 respectively.
The sale price of the producer becomes the purchase price of the trader which was ` 5890 in channel I and ` 5240 in channel II. The marketing costs of the trader in the channel I and channel II are ` 259.30 and ` 70.51 respectively. The marketing margins of the trader were
` 486.70 and ` 479.80 in channels I and II respectively.
The wholesaler was not involved in the marketing channel I. The purchase price of the wholesaler in the marketing channel II was ` 5790.31 which accounted for about 88.50 per cent of the retailer sale price. The marketing costs and the marketing margin of the wholesaler is ` 172.03 and ` 272 respectively. The wholesaler sale price is ` 6234.34 which was 95.29 percent of the retailer sale price or the consumer purchase price.
The retailers purchase price is the trader’s sale price in the case of marketing channel I and wholesaler sale price in the channel II which was ` 6636 and ` 6234.34 respectively. The marketing costs and the marketing margin of the trader in channels I and II was ` 53.44 and
` 44.20, Rs 268.90 and ` 240 respectively. The retailer’s sale price or the consumer purchase price of one quintal groundnut pods is ` 6,958.34 and ` 6,518.54 respectively in channels I and II.
Producer ® Processor ® Wholesaler ® Retailer ® Consumer
Producer ® Trader ® Processor ® Wholesaler ®
Retailer ® Consumer
In the study area channel I was adopted by the FPO members and channel II was adopted by Non FPO members in the marketing of redgram.
In Table 3, the price spread analysis of the marketing channel I and II was analysed and presented. The figures in Table 3 depict that the producers share in the consumers rupee was more in the channel I i.e. 78.40 per cent which was adopted by the FPO members compared to the channel II whose value is 70.19 per cent and this channel was adopted by the Non FPO members. The price spread was comparatively less in channel I compared to channel II which was ` 1547 (21.60%) and ` 2101.28 (29.80%) respectively.
The producer’s sale price in Channel I and channel II was ` 5780 and ` 5120 respectively. The marketing
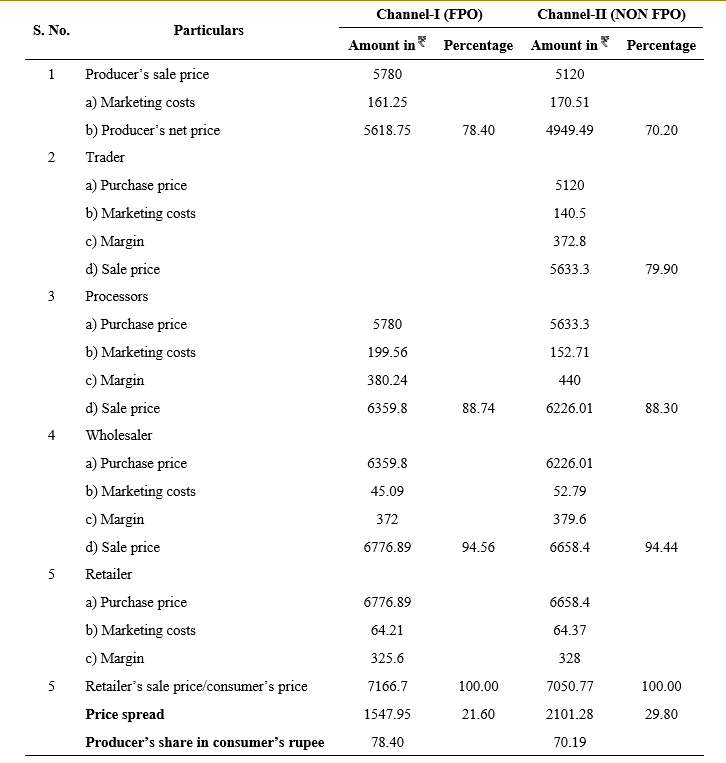
costs expended by the producer in marketing channel I and II was ` 161.25 and ` 170.51 respectively. The producer’s net price of both channels is ` 5618.75 and ` 4949.49 which accounted for 78.40 per cent and 70.20 per cent of the consumer’s price.
The traders were not involved in channel I which was adopted by the FPO members. The traders purchase price was ` 5120 and the marketing costs and the marketing margins was ` 140.5 and ` 372.80 respectively. The trader’s sale price in the marketing channel II was ` 5633.3 which accounted for about 79.90 per cent of the consumers rupee.
The processors purchase price was ` 5780 and ` 5633.3 of the marketing channel I and II respectively. The marketing costs of the processor in marketing channel I and II was ` 199.56 and ` 152.71 respectively. The marketing margins of processors in both the channels was ` 380.24 and ` 440 respectively. The processors sale price was ` 6359.80 and ` 6226.01 which accounted for 88.74 per cent and 88.30 per cent of the consumer’s price.
The purchase price of the wholesaler was ` 6359.80 and ` 6226.01 in marketing channel I and II respectively. The marketing costs of the wholesaler in both the channels was ` 45.09 and ` 52.79 respectively. The marketing margins of the wholesaler was ` 372 and ` 379.6 in both the marketing channels. The wholesaler’s sale price of marketing channels I and II was ` 6776.89 and ` 6658.4 respectively which accounts for about 94.65 per cent and 94.44 per cent of the consumer’s price.
The retailer purchase price in the channel I and channel II was ` 6776.89 and ` 6658.40 respectively. The marketing costs incurred by the retailer was ` 64.21 in channel I and ` 64.37 in channel II. The marketing margins are ` 325.6 and ` 328 of the retailer in marketing channel I and II. The retailer’s sale price and the consumers purchase price was ` 7166.7 and ` 7050.77.
From all the above discussions it was obvious that the producers of the channel I obtain a higher price and greater share in comparison with producers in channel
The price per quintal of the produce for FPO members is higher compared to non FPO members due to their aggregate power of bargaining and linking
with profitable marketing channels. The two marketing channels were noticed in the study area of which marketing channel I was adopted by the FPO members and channel II was adopted by Non FPO farmers. The price spread in the FPO members marketing channel was relatively less compared to the non FPO members due the decreased length of the marketing channel of FPO farmers. Producer’s share in the consumers’ rupee received by the FPO farmers of is more than the Non- FPO farmers which accounted to 88.96 per cent in the Channel I which was higher compared to Channel II accounted to 85.41 per cent in the cotton marketing , Like wise in the groundnut marketing, it accounted for 82.71 per cent for channel I and 77.86 per cent for channel II and in redgram marketing it accounted for 78.40 per cent in the channel I and 70.19 per cent in the channel II in the study area. This difference is due to reduction in the transaction costs and the market margins in the channel
post harvest processing units for creating value addition of the produce and in promotion of packaging ,branding and enhancing export potential of the produce in the study area. Market linkages with top private market players should be created to generate competition among buyers so as to get maximum benefit to the farmer.
Anika, T. 2014. Linking small farmers to modern retail through producer organizations – Experiences with producer companies in India. Food Policy. 45(1): 35-44.
Bingen, J., Serrano, A and Howard, J. 2003. Linking farmers to markets: Different approaches to human capital development. Food Policy. 28(4): 405-419.
Elisabeth, F and Matin, Q. 2011. Linking smallholders to markets: Determinants and impacts of farmer collective action in Kenya. World Development. 40(6): 1255-1268.
Kandeeban, M and Prabhavathi, Y. 2017. Marketing efficiency and market competitiveness of farmer produce companies (FPCs) – A case study of Telangana and Karnataka states. The Journal of Research ANGRAU. 45(2): 100-107.