
0 Views
S. HIMA BINDU*, L. PRASANTHI, V. LAKSHMI NARAYANA REDDY AND P. LATHA
Department of Genetics and Plant Breeding, S.V. Agricultural College, ANGRAU, Tirupati-517502. Andhra Pradesh, India
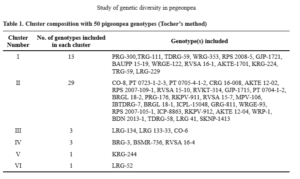
A set of 50 pigeonpea genotypes were evaluated during kharif season 2019-20 at Regional Agricultural Research Station (RARS), Tirupati, Andhra Pradesh to assess the genetic diversity. The study revealed wide range of genetic diversity among genotypes for all yield, physiological, leaf morphological and biochemical attributing characters. D2 analysis grouped 50 genotypes into 6 clusters. Cluster II was the largest consisting of 29 genotypes, followed by Cluster I containing 13 genotypes, Clusters III and IV had 3 genotypes each and the Cluster V and VI was solitary. The inter-cluster D2 values indicated most diverse Clusters III and IV (4187.56) followed by Clusters II and IV (3686.56).The highest intra-cluster distance was observed in Cluster III (273.66) followed by cluster II (234.81). On the basis of cluster mean values, Cluster III was superior for number of primary branches per plant, number of pods per plant and seed yield per plant. Cluster IV was superior for 100 seed weight, leaf thickness and phenol content and resistance to sterility mosaic disease. Leaf hairiness and number of pods per plant together contributed 81.63 per cent for divergence, hence these traits were emphasized for selection of genotypes for hybridization.
Cluster analysis, genetic diversity, pigeonpea
Pigeonpea (Cajanus cajan (L.) Millsp), also known as redgram or arhar or tur is an important legume crop after gram (bengalgram) from the family, Fabaceae. Pigeonpea is an excellent source of protein (20-22%), supplementing the energy rich source mainly for vegetarians. Hence, it is mainly grown in developing countries like India where majority of the people depend on low priced vegetarian foods for meeting their dietary requirements. It is sixth most important legume crop with production of 59.60 lakh tonnes in the world. India and Myanmar are the major producers of pigeonpea in the world (FAOSTAT, 2018). In India, it is cultivated in an area of 44.38 lakh hectares with a production of 42.89 lakh tonnes and average productivity of 967 kg ha-1 (Government of India, 2018). Although, India leads the world both in area and production of pigeonpea, its productivity is lower than the world average. The poor productivity in India is attributed primarily due to poor spread of improved varieties and technologies, untimely and inadequate availability of quality seed of improved varieties and other inputs, water-stress due to dependence on rainfall, low and high temperature stress, cultivation on marginal and sub-marginal land. These made the crop frequently prone to abiotic (waterlogging, nutrient, cold, salinity and terminal moisture stress) and biotic (weeds, diseases like Fusarium Wilt, leaf blight, sterility mosaic disease, pod borer complex and pod-fly) stresses. Mahalanobis D2 statistics has extensively been used by several workers to study the genetic diversity in different agronomic crops and to identify the characters or characters responsible for such type of divergence. Using Mahalanobis D2 statistics, the population can be classified in to different groups. Keeping in view, present experiment has been undertaken to study genetic diversity for selecting suitable parents for pigeonpea breeding programme aimed at isolating desirable segregants for seed yield and other important characters.
The experiment was carried out during kharif, 2019 at Regional Agricultural Research Station (RARS), Tirupati. The experimental materials comprised of 50 genotypes were sown in a Randomized Block Design (RBD) in three replications in three rows of length 4 m with spacing of 90 × 20 cm. The package of practices recommended for the crop was followed. Yield, physiological, leaf morphological and biochemical traits viz., plant height, days to 50 per cent flowering, days to maturity, number of primary branches per plant, number of secondary branches per plant, number of pods per plant, hundred seed weight, harvest index, SPAD chlorophyll meter reading, specific leaf area, relative water content, seed yield per plant, leaf trichome density, leaf thickness, amino acid content, phenol content, carbohydrate content, protein and sterility mosaic disease percentage were recorded from randomly selected plants in each of the genotype in each replication, except days to 50 percent flowering and days to maturity which were recorded on plot basis while sterility mosaic disease percentage readings were taken in artificial screening. Data was subjected to D2 analysis to estimate the genetic diversity among the genotypes (Mahalanobis, 1936).
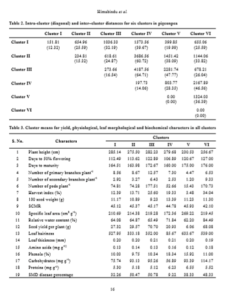
D2 statistics and cluster analysis grouped 50 pigeonpea genotypes into 6 clusters. This indicated existence of high degree of genetic diversity in the genotypes evaluated in this study. Therefore, these genotypes would serve as valuable source for selection of diverse parent. Cluster pattern revealed that, Cluster II was largest consisting of 29 genotypes, followed by Cluster I containing 13 genotypes, Cluster III and IV had 3 genotypes each and the Cluster V and VI had one genotype each (Table 1). The discrimination of genotypes into many discrete clusters indicated presence of substantial diversity in the evaluated material. The intra and inter-cluster distance among different clusters has been given in Table 2. The inter-cluster distances were greater than intra-cluster distances, revealing that considerable amount of genetic diversity existed among the genotypes of different clusters. Maximum differences among the genotypes within the same cluster (intra cluster) were shown by Cluster III (273.66) followed by Cluster II (234.81) which indicated maximum variability among genotypes within the cluster. While the minimum intra-cluster distance observed in Cluster V and VI which had one genotype i.e., zero intra-cluster distance indicated that genotypes of these clusters could be closely related in their evolutionary process and passed through similar evolutionary factors, hence selection will be ineffective. Inter-cluster distance is the main criterion for selection of genotypes using D2 analysis. The maximum intercluster distance was recorded between Cluster III and IV (4187.56) followed by Cluster II and IV (3686.56). Genotypes belonging to the clusters with maximum intercluster distance are genetically more divergent and hybridization between genotypes of divergent clusters would be useful to improve the yield potential in pigeonpea. Inter-cluster distances were greater in magnitude confirming the presence of diversity among clusters, that crossing between genotypes from diverse clusters may provide a wide spectrum of genetic diversity. Minimum inter-cluster distance was observed between Cluster I and V (399.85) which indicated close relationship between genotypes of these clusters, which would not provide any significant diversity.
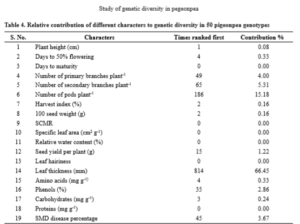
The mean performance of all the characters in different clusters is presented in Table 3. The genotypes in the Cluster I showed tallness whereas the genotypes in the Cluster II exhibited low leaf hairiness and low leaf phenol content. Cluster III recorded high number of primary branches per plant, high number of pods per plant, low 100 seed weight, high seed yield per plant, high leaf thickness, low amount of leaf protein and high SMD percentage. Similarly, Garhewal et al. (2013); Navneet et al. (2017) and Baldaniya et al. (2018) also reported that cluster with high cluster means for number of primary branches per plant, number of pods per plant also showed high seed yield per plant. Early flowering, early maturity, high 100 seed weight, low specific leaf area, high leaf hairiness, high leaf thickness, high leaf phenol content, low amount of leaf carbohydrate and low SMD percentage was recorded in Cluster IV. Pushpavalli et al. (2017) and Kumar et al. (2019) also reported early flowering and early maturity for the genotypes of the same cluster in their study. Shorter plants, low number of primary branches per plant, low number of secondary branches per plant, low number of pods per plant, low harvest index, high SCMR, high specific leaf area, low relative water content, low seed yield per plant, low leaf amino acid content and high amount of leaf protein was recorded in Cluster V. The Cluster VI recorded delayed flowering, delayed maturity, high number of secondary branches per plant, high harvest index, low SCMR, high relative water content, low leaf thickness, high amount of amino acid and carbohydrate content. Cluster VI showed highest mean for most of the characters viz., days to 50% flowering (127.00), days to maturity (176.00), secondary branches per plant (9.33), harvest index (34.04), relative water content (84.49), amino acid content (0.18) and carbohydrate content (114.17). While Cluster V showed lowest mean for most of the characters viz. plant height (230.53), number of primary branches per plant (4.47), number of secondary branches per plant (1.20), number of pods per plant (15.48), harvest index (3.48), relative water content (62.20), seed yield per plant (6.06) and amino acid content (0.12). Intercrossing among the genotypes from the diverse clusters could be suggested
to generate a wide spectrum of variability followed by effective selection for these characters. The utility of D2 statistics is enhanced by its applicability to estimate relative contribution of various characters towards genetic divergence. Among the characters studied, leaf hairiness contributed the maximum (66.45 %) towards the diversity by taking first rank 814 times, followed by number of pods per plant (15.18 %) with 186 times ranked first. Present findings are in confirmation with the reports of Reddy et al. (2015) and Navneet et al. (2017). The characters viz., number of secondary branches per plant (5.31 %) with 65 times ranked first, number of primary branches per plant (4.00 %) with 49 times ranked first, SMD percentage (3.67 %) with 45 times ranked first and leaf phenol content (2.86 %) with 35 times ranked first contributed towards the diversity. Similarly, seed yield per plant contributed (1.22 %) with 15 times ranked first towards the divergence. Days to 50% flowering and leaf amino acid content (0.33 %) with four times ranked first, leaf carbohydrate content (0.24 %) with three times ranked first, harvest index and 100 seed weight (0.16 %) with two times ranked first and plant height (0.08 %) with one time ranked first contributed minimum towards the divergence (Table 4). On the contrary days to maturity, SPAD chlorophyll meter reading, specific leaf area, relative water content, leaf thickness and leaf protein content had zero contribution towards genetic divergence.
From the present investigation, it was concluded that Cluster III and Cluster IV were more divergent clusters. Leaf hairiness has maximum contribution for genetic divergence followed by number of pod per plant. The genotypes of Cluster III (LRG-134, LRG 133-33 and CO6) showed highest cluster mean values for most of the yield contributing characters, and the genotype of Cluster IV (BRG-3, BSMR-736 and RVSA 16-4) showed superior performance as early flowering, early maturity, high leaf thickness and high phenol content. Therefore, genotypes from Cluster III and Cluster IV could be utilized as potential parents in crossing programme for improving more than one economic character such as high yield, early maturity and sterility mosaic disease resistance in pigeonpea.
Baldaniya, J.D., Kale, B.H., Mungra, K.S., Patel, H.N., Lad, M.D and Chauhan, D.A. 2018. D2 analysis for yield and quality traits in pigeonpea [Cajanus cajan (L.) Millsp.]. International Journal of Chemical Studies. 6(5): 2723-2725.
FAOSTAT. 2018. FAO-Quarterly bulletin of statistics. Food and Agricultural Organization of United Nations. Rome.
Garhewal, P.K., Sharma, R.N., Rathore, H.K and Pakira, S.S. 2013. Divergence analysis in pigeonpea (Cajanus cajan L.). Journal of Agriculture. 18(1&2): 83-85.
Government of India, 2018. Agricultural statistics at a glance, Directorate of Economics and Statistics, Ministry of Agriculture and Farmers Welfare, New Delhi.
Kumar, A., Singh, A., Kumar, R., Singh, A and Gangwar, L.K. 2019. Genetic divergence in pigeonpea [Cajanus cajan L.]. Bulletin of Environment, Pharmacology and Life Sciences. 8(10): 16-19.
Mahalanobis, P.C. 1936. On the generalized distance in statistics. Proceedings of National Institute of Sciences (India). 2: 49-55.
Navneet, S., Sikarwar, R.S., Singh, A.K and Kumar, R.A. 2017. Genetic diversity in pigeonpea [Cajanus Cajan L. Millsp.]. International Journal of Agriculture Sciences. 9(18): 4177-4179.
Pushpavalli, S.N.C.V.L., Sudhakar, C., Rani, C.S., Rajeswari R.R and Rani, C.J. 2017. Genetic divergence, correlation and path coefficient analysis for the yield components of pigeonpea genotypes. Legume Research. 40(3): 439-443.
Reddy, V.G., Jayalakshmi, V and Srenivas, T. 2015. Genetic divergence studies in pigeonpea inbreds. Electronic Journal of Plant Breeding. 6(2): 515-520.