
0 Views
Department of Genetics & Plant Breeding, S.V. Agricultural College, ANGRAU, Tirupati – 517 502.
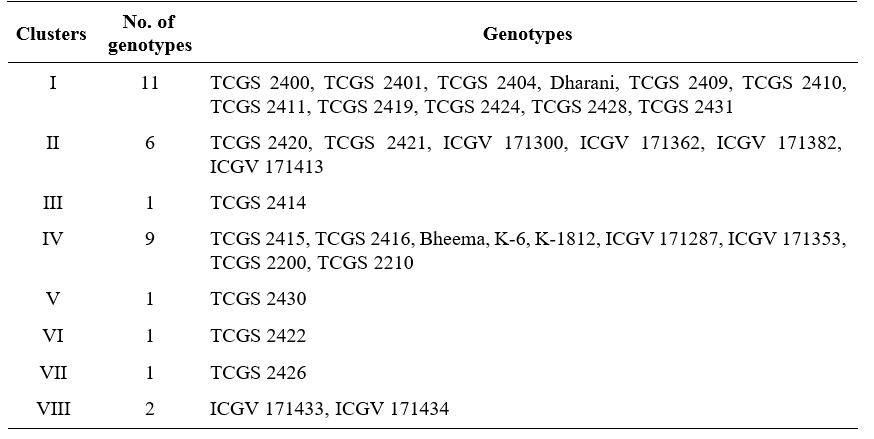
A set of thirty two groundnut genotypes were assessed for genetic diversity during kharif season of 2022 using Mahalanobis D2 statistics with regards to pod yield, yield attributing characters and quality traits. Among the characters studied, the shelling percent contributed maximum towards the total divergence. The groundnut genotypes were grouped into 8 clusters using Tocher’s method of clustering. Among these 8 clusters, cluster I had maximum number of 11 genotypes followed by cluster IV with 9 genotypes, cluster II with 6 genotypes, cluster VIII with 2 genotypes and the remaining clusters (III, V, VI and VII) were solitary cluster having only one genotype. Cluster IV had the maximum intra cluster distance followed by cluster VIII. The maximum inter- cluster distance was observed between cluster VII and VIII followed by cluster IV and cluster VII. In order to get better segregants for yield and yield parameters, taking into consideration the cluster distances and cluster means in the current experiment, the crossing between the genotypes from clusters II and VII is rewarding.
KEYWORDS: Cluster means, genetic diversity, groundnut, Mahalanobis D2 statistic.
Groundnut is one of the most important oil seed crop of India which is native to Brazil. It is an annual legume, self-pollinated, allotetraploid (2n = 4x = 40) belongs to family Fabaceae (earlier Leguminosae). Groundnut is known as a “wonder legume” for its flowering, pegging and pod formation pattern (Boraiah et al., 2012). It contains oil (48-50%), protein (26-28%), carbohydrates (8-14%). It provides 564 kcal of energy from 100 g of kernels. The kernels are also rich in minerals such as calcium, phosphorus and iron, as well as vitamins such as vitamin E, niacin, folic acid, riboflavin and thiamine. Apart from its usage for diet and industry, peanuts are getting popular due to the existence of “resveratrol” a naturally occurring phytoalexin phenolic compound produced in plants under stress conditions. Resveratrol has a variety of health benefits, including the effects against aging, cardiovascular diseases, cancers and atherosclerosis (Baur and Sinclair, 2006).
India ranks first in groundnut area under cultivation and is the second largest producer in the world with 101 lakh tonnes with productivity of 1.86 ton per hectare in 2021-22 (Crop outlook report of AP, ANGRAU, 2022). Knowing the value of groundnut as a significant oilseed crop, in addition to ensuring food security, assessment of genetic diversity is essential for planning an effective breeding programme (Reddy et al., 2018). The divergence analysis plays an effective role in choosing divergent parents for hybridization. Keeping the above in view, the present investigation was undertaken to identify the best performing genotypes.
The experimental material for the present investigation comprised of 32 groundnut genotypes obtained from Regional Agricultural Research Station (RARS), Tirupati, ANGRAU which is located at an altitude of 182.9 m above the mean sea level and are sown in dry-land farm during Kharif 2022 using a randomized block design (RBD) with three replications of 5 m row length at a spacing of 30 cm between rows and 10 cm within the row.
For each genotype of groundnut, observations were recorded on five competitive plants at random except for days to 50% flowering and days to maturity, which were recorded on plot basis for seventeen physiological, yield and quality traits viz., specific leaf area, SPAD chlorophyll meter reading, relative water content, plant height, number of primary branches plant-1, number of secondary branches plant-1, hundred pod weight, shelling percent, hundred kernel weight, sound mature kernels percent, protein content, oil content, dry haulms yield plant-1, kernel yield plant-1 and pod yield plant-1. The data collected was subjected to Mahalanobis D2 statistic (Mahalanobis, 1936) and first suggested by Rao (1952) for the assessment of genetic diversity in plant breeding. Grouping of 32 genotypes of groundnut into different clusters were performed by Tocher’s method.
The methods of Singh and Chaudhary (1977) were used for calculating the intra and inter cluster distances.
The thirty two genotypes studied in the present investigation were grouped in to eight clusters based on D2 values (Table 1). Among the eight clusters, Cluster I is the largest with eleven genotypes followed by Cluster IV, Cluster II and Cluster VIII with nine, six and two genotypes respectively. Remaining clusters viz., Cluster III, V, VI and VII consists of single genotype. Similar findings were obtained by Chavadhari et al. (2017), Yadav et al. (2022) and Sukrutha et al. (2023).
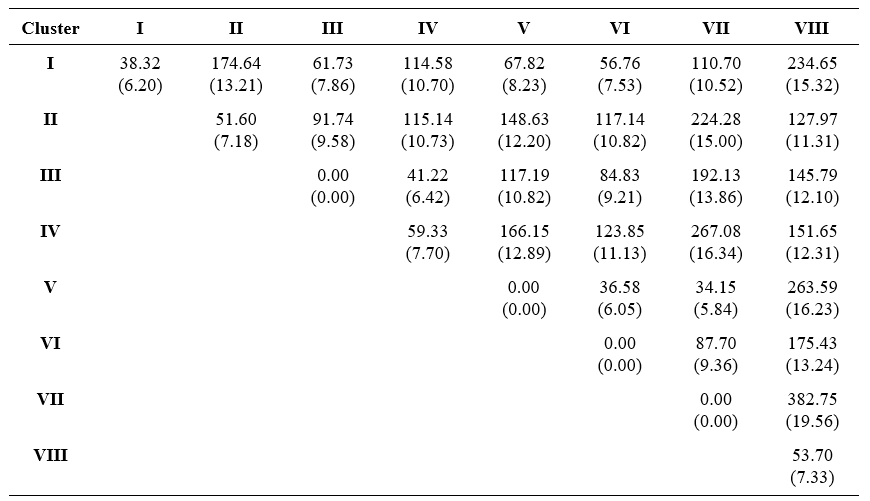
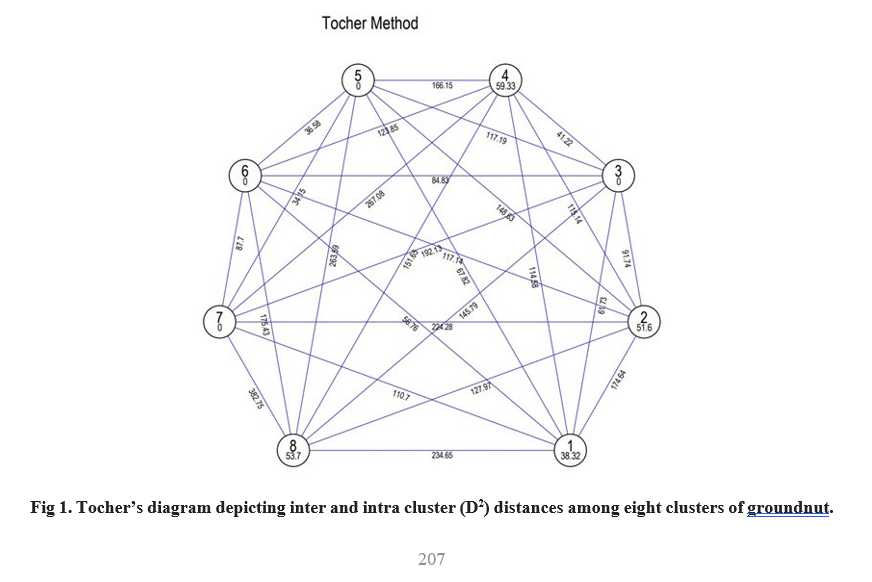
Inter- cluster distances (Table 2, Fig 1) were higher than intra- cluster distances indicating the availability of wider genetic diversity between the clusters rather than with in the clusters. Maximum intra- cluster distance was observed in cluster IV (59.33) followed by cluster VIII (53.70), cluster II (51.60) and cluster I (38.32). his indicates the genotypes present in these clusters had wide variation among themselves. These results were confirmed with the findings of Suneetha et al. (2013), Shruti et al. (2019) and Dudhatra et al. (2022). Highest inter- cluster distance was observed between cluster VII and cluster VIII (382.75) followed by cluster IV and cluster VII (267.08), cluster V and cluster VIII (263.59), cluster I and cluster VIII (234.65) and cluster II and cluster VII (224.28). Hence, the hybridization between
genotypes of these clusters may create more variability in segregating population. Whereas, minimum inter- cluster distance was identified between cluster V and VII (34.15) followed by cluster V and VI (36.58), cluster III and cluster IV (41.22). This states that clusters showing low inter- cluster distances are genetically nearer than clusters showing high inter- cluster distances.
Based on mean performance of different characters for various clusters revealed that genotypes present in the cluster VI (25.00 days) was early for days to 50% flowering and possesses low specific leaf area (153.87 cm2 g-1), high SPAD chlorophyll meter reading (44.87) and high kernel yield plant-1 (13.80). Genotypes in cluster V showed higher values for relative water content (90.40%) and lesser values for plant height (40.13 cm). Cluster III recorded low values for days to maturity (101.00 days) and possessed maximum mean value for sound mature kernels (90.87%). The number of primary branches plant-1 and dry haulms yield plant-1 had highest cluster mean values of 7.67 and 31.43g was observed in cluster VIII. The maximum mean value of secondary branches plant-1 (4.00), hundred pod weight (123.67g), shelling percent (75.70%), hundred kernel weight (61.07g) was recorded in cluster VII. The cluster IV showed maximum mean value for protein content (26.43%). The cluster I showed superior performance for oil content (48.27%). The maximum mean value for pod yield plant-1 (20.99g) was recorded in cluster II. Therefore, crosses between
members of clusters having high inter cluster distance along with high mean value for important characters are likely to be highly rewarding (Rajalakshmi et al., 2020).
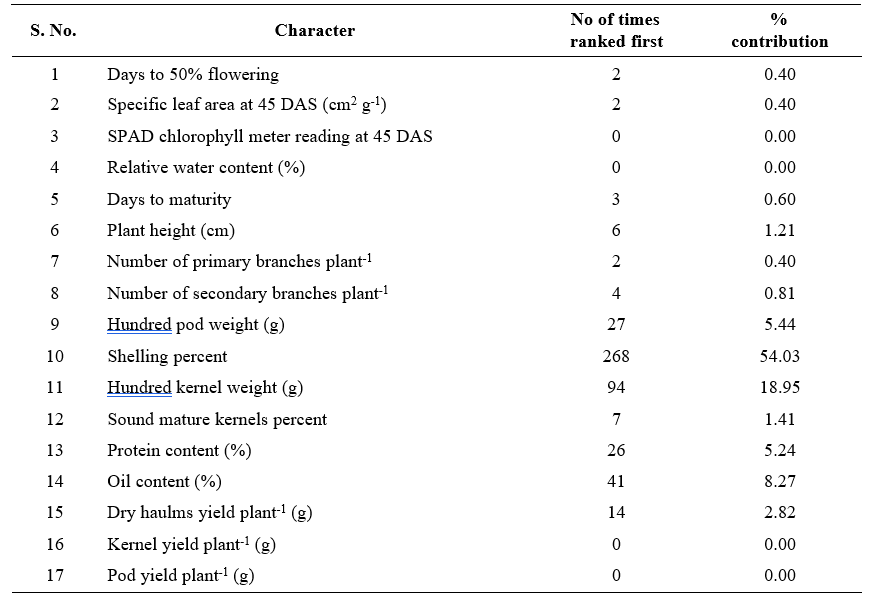
Information on the relative contribution of various plant characters towards divergence has also been reported to aid the breeder in choice of parents for hybridization and effective selections in the advance generations (Suneetha et al., 2013). In the present study, shelling percent contributed maximum (54.03%), followed by hundred kernel weight (18.95%), oil content (8.27%), hundred pod weight (5.44%), protein content (5.24%) towards the total divergence (Table 3). The results obtained are in agreement with the findings of Mahalakshmi et al. (2005) for shelling percent, Raghuwanshi et al. (2016) for hundred pod weight, Vivekananda et al. (2015) and Yadav et al. (2022) for hundred kernel weight, Shruti et al. (2019) and Dudhatra et al. (2022) for protein and oil content. Contribution of the remaining characters to total divergence was, however, relatively low. Therefore, the characters shelling percent, hundred kernel weight, oil content, hundred pod weight, protein content contributing to 92.00 per cent of the total divergence need to be stressed in selection of parents for hybridization.
From the present study it was concluded that, based on the divergence analysis the crosses viz., TCGS 2426× ICGV 171434, Bheema × TCGS 2426, TCGS 2430 × ICGV 171434, TCGS 2419 × ICGV 171434, ICGV 171382 × TCGS 2426 and ICGV 171362 × TCGS 2426 were identified as the best cross combinations to get transgressive segregants for physiological, yield and quality traits.
Baur J and Sinclair D.A. 2006. Therapeutic potential of resveratrol, the in vivo evidence. Nature reviews Drug Discovery. 5(6): 493–506.
Boraiah, K.M., Goud, S., Gejli, K., Konda, C.R., Babu and H.P. 2012. Heterosis for yield and yield attributing traits in groundnut (Arachis hypogaea L.). Legume Research. 35(2):119-125.
Chavadhari, R.M., Kachhadia, V.H., Vachhani, J.H and Sharma, S. 2017. Research Note Genetic divergence in groundnut (Arachis hypogaea L.). Electronic Journal of Plant Breeding. 8(3):1000-1005.
Crop Outlook Reports of Andhra Pradesh.
Groundnut-2022. ANGRAU. P.1
Dudhatra, R.S., Viradiya, Y.A., Joshi, K.B., Desai, T.A and Vaghela, G.K. 2022. Genetic divergence analysis in groundnut (Arachis hypogaea L.) genotypes. Emer Life Science Research. 8(1):114-118.
Mahalakshmi, P., Manivannan, N and Muralidharan, 2005. Variability and correlation studies in groundnut (Arachis hypogaea L.). Legume Research. 28(3):194-197.
Mahalonobis, P.C. 1936. On the generalized distance in statistics. Proceedings of the National Institute of Science of India. 12: 49-55.
Raghuwanshi, S.S., Kachhadia, V.H., Vachhani, J.H., Jivani, L.L and Patel, M.B. 2016. Genetic divergence in ground nut (Arachis hypogaea L.). Electronic Journal of Plant Breeding. 7(1):145-151.
Rajalakshmi, K., Manivannan, N., Anand, G., Vanniarajan, C and Harish, S. 2020. Genetic divergence among black gram [Vigna mungo (L.) Hepper] genotypes using Mahalanobis D2 statistic. Electronic Journal of Plant Breeding. 11(1):116- 119.
Rao, C.R. 1952. Advanced Statistical Methods in Biometrical Research. John Wiley and sons. New York. 236-272.
Reddy, AK., Priya, MS., Reddy, DM and Reddy, BR. 2018. Genetic divergence studies in black gram [Vigna mungo (L.) Hepper]. International Journal of Pure and Applied Bioscience. 6(5):232-237.
Shruti, K., Rao, V.S., Rani, M.G., Sreekanth, B., Kumar, V.M and Umar, N., 2019. Genetic diversity studies in yield and its contributing traits in groundnut (Arachis hypogaea L.) genotypes using D2 statistics. International Journal Current Microbiology and Applied Sciences. 8(6):32-38.
Singh, R.K and Chaudhary, B.D. 1977. Biometrical methods in quantitative genetic analysis. Kalyani Publishers, New Delhi. 215-218.
Sukrutha, B., Kumar, A.R.N and Akkareddy, S. 2023. D2 analysis to evaluate the genetic diversity of peanut (Arachis hypogaea L.). Agricultural Science Digest.
Suneetha, N., Vasanthi, R.P., Sudhakar, P and Reddy, K.R. 2013. Genetic diversity analysis among released and pre-release cultures in groundnut. Legume Research-An International Journal. 36(3): 208-213.
Vivekananda, Y., Khoyumthem, P and Singh, N.B. 2015. Genetic divergence analysis in groundnut (Arachis hypogaea L.). Electronic Journal of Plant Breeding. 6(1): 315-317.
Yadav, G.L., Rajput, S.S., Gupta, D., Kunwar, R., Yadav, O.P and Meena, A.K. 2022. Assessment of genetic diversity in groundnut (Arachis hypogaea L.) genotypes under semi-arid condition of Rajasthan. The Pharma Innovation Journal. 11(4): 538-541.