
0 Views
N. VANI* AND S. RAJESWARI
Department of Agricultural Economics, S.V. Agricultural College, Tirupati – 517 502, Andhra Pradesh, India.
The present study was undertaken to examine the price behavior of cocoons in Dharmavaram market of Andhra Pradesh. There was significant increasing trend in prices of cocoons in selected market and found to be significant statistically during 2006-2015. The highest seasonal index was found in August (110.69) while the lowest seasonal index in the month of May (92.25). The cocoon prices exhibit no oscillary movement and no definite periodicity in their occurrence during study period.
Moving average method, price behavior, seasonal indices, trend analysis, cyclical variations and irregular price fluctuations
Over hundreds of years, silk has become an inseparable part of Indian culture and tradition. Sericulture is the cultivation of silk through rearing of silkworms. Till date, no fabric in the world has conquered this Queen of Textiles and this is the magic of silk. Over the centuries, it has been an indispensable part of Indian culture and traditions. India occupies second place after China with 28,708 tonnes of global production. Total value received from exports of silk goods stood at Rs. 2,720.7 crore. (Govt. of India, Ministry of Textile, 2013). Andhra Pradesh occupies first position in terms of productivity and second position in the country next to Karnataka in production of silk. In view of its importance in increasing the socio-economic welfare of the small and marginal farmers and need to propagate sericulture industry the state government is going on large scale to boost up the industry (Kasi, 2013). Compared to agricultural crops, sericulture provides more employment opportunities and fetches higher income to the rural farm families. Sericulture has been an important income generating cottage based industry in the country since ancient period (Trivedi and Sarkar, 2015). Sericulture is like Akshayapatra, where in the farmers will be getting a regular monthly income because it is one month crop.
Price play a vital role in the determination of determines the profitability of cocoon growers in Andhra Pradesh. In this context, it is very important to know the price behavior of cocoons. The main objective of the present research was to analyze the price behavior of cocoons in Dharmavaram market of Andhra Pradesh state.
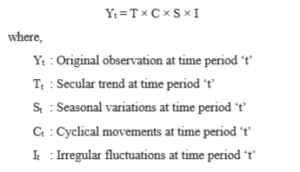
Purposively the study was conducted in the Dharmavaram market of Andhra Pradesh state as it is the major cocoons market of the state. Time series analysis was employed for studying the price behavior of cocoons in Dharmavaram market. Secondary data for Dharmavaram market was collected in the form of monthly modal prices for a period of 10 years from 2006 to 2015. To analyse all the four components of a time series viz., trend, seasonal, cyclical and irregular fluctuations, a multiplicative model of the following type was used (Vasudev, 2015)
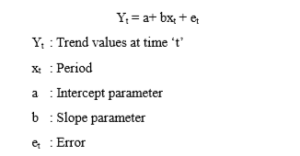
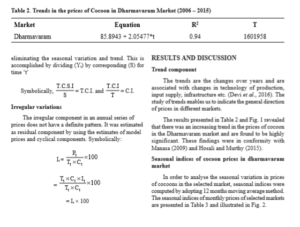
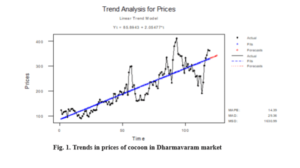
Over a long period, time series is likely to show tendency to either increase or decrease over time. Price trend explains the general direction of the movement of prices over long period of time. Ordinary least square method was employed to ascertain the trends in prices by estimating the intercept (a) and slope coefficient (b) in the following linear functional form.
The goodness of fit of trend line to the data was tested by the coefficient of multiple determination which is denoted by R2.
As a first step to estimate the seasonal index, a 12 month centered moving average was calculated as follows.
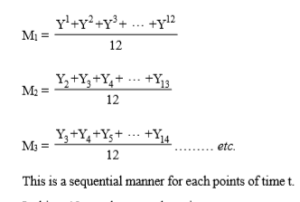
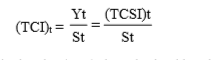
In this, a 12 month centered moving average removes a large part of fluctuation due to the seasonal effects remains is mainly attributable to other sources viz., long term effects Tt, cyclical effect Ct and the irregular variation It which is due to random causes is also minimized by the process of smoothing out effect. Thus, this affords a means of not only estimating TC effect but also estimating seasonal components.
In computing the seasonal index, the original series is divided by the centered moving average. This gives the first estimate of seasonal component St.
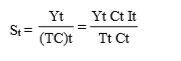
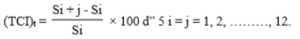
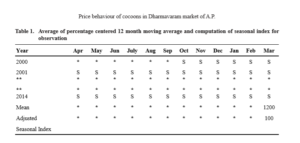
It is always expressed in terms of percentages. In this process, we do not have moving average for the first six and last six months. These seasonal components are next arranged month-wise for each year (Table 1). The last row in the Table 1 gives estimates of seasonal index for the 12 months adjusted for their total to 1200 or averaged to 100. The last row in the Table 1 gives the first estimates of seasonal variations. In order to obtain a better estimate i.e., stabilized seasonal indices we need to employ an interactive process as under. The original observation (Yt) is divided by corresponding (St) value and then obtain the residual (TCI)t corresponding to time point t.
The residual series (TCI)t thus obtained is subjected to the same process of determining 12 month centered averages as done earlier to obtain better estimates for trend cycle effect viz., (TC)t. These revised estimates are next employed as above to generate a revised set of seasonal indices by dividing each observation (Yt) by the corresponding (TC)t value. This will lead to revise estimates of seasonal indices (St) as second interactive ones.
This interactive process is separately employed until stabilized seasonal indices are obtained i.e., two successive seasonal indices do not differ by more than five per cent. Where adjusted seasonal indices = Seasonal indices × correction factor
Cyclical variations are long term oscillatory movements with duration of greater than one year. The most commonly used method for estimating cyclical movement of time series is the residual method by
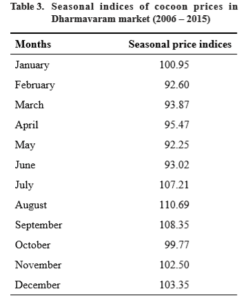
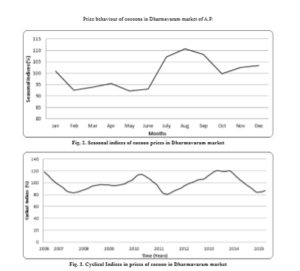
In Dharmavaram market the highest seasonal index was found in August, followed by September and July as the indices stood at 110.69, 108.34 and 107.21 respectively (Table 3 and Fig. 2). Lowest seasonal index was recorded in May with 92.25. From the table it was evident that, during the months from July to January farmers fetched good prices as the climate was favorable for cocoon rearing and reeling of silk that facilitates for good quality of silk. Hence there was high demand for quality of cocoons during these months that fetched good prices. Also during the months from February to June the climate is hot in the region that adversely affects rearing of cocoons and the silk will be of low quality. Though the arrivals of cocoons in these periods were low, farmers got low prices because of poor quality. This was in line with Choudannanavar (2015).
Cyclical variation in prices was analyzed in order to know the variation in prices over the years. The results of cyclical variations of cocoons prices in the Dharmavaram market graphically presented in Fig. 3 indicated that no price cycles were identified. These findings were in conformity with Bharathi (2009).
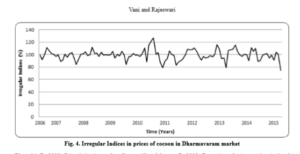
Irregular price movements represent that part of the behaviour of prices, which is not systematic. No generalisation can be made about such price fluctuations because of the irregularity in their occurrence. The irregular indices of prices of cocoons in Dharmavaram market is graphically depicted in Fig. 4. It is evident from the graph that the irregular fluctuations did not exhibit any definite periodicity in their occurrence in the market. In the present study, results have been revealed that the prices of cocoon increased significantly during the study period and highest in the month of August while lowest prevailed in the month of May. The cocoon prices established no oscillatory movement along with trend line during the period 2006-2015.
Choudannanavar, B.K. 2015. Price behaviour of silk cocoons in Karnataka. Indian Journal of Applied Research. 5(8): 24-27.
Bharathi, R. 2009. Price behaviour of mulberry silk cocoon in ramnagar and siddlaghatta market – A statistical analysis. M.Sc. (Ag.) Thesis. University of Agricultural Sciences, Dharwad, Karnataka, India.
Devi I.B., Srikala, M and Ananda T. 2016. Price behavior of chillies in Guntur market of Andhra Praesh, India. Indain Journal of Agricultural Research. 50(5): 471474.
Kasi, E. 2013. Role of Sericulturists in the development of a village: An anthropological case from post-green revolution South India. South Asian Survey. 20(1): 114-136.
Government of India. 2013. Ministry of Textiles. Press Information Bureau. New Delhi.
Roopa, H and Murthy, C. 2015. Trends in arrivals and prices of cocoons in Shirahatti market at Haveri district. International Journal of Business and Management. 8(1): 131-134.
Manasa, R. 2009. Dynamics of prices and arrivals of pigeonpea in Karnataka: An econometric analysis. MBA (Agribusiness) Thesis, University of Agricultural Sciences, Dharwad, Karnataka, India.
Trivedi, S and Sarkar, K. 2015. Comparative study on income generation through agriculture crop and sericulture at farmer’s level. Journal of Entomology and Zoology Studies. 3(1): 242-245
Vasudev, S. 2015. A study on the price instability and price behavior of rice in Andhra Pradesh. Indian Journal of Agricultural Marketing (Special conference). 29(3): 26-32.