
0 Views
Institute of Agribusiness Management, S.V. Agricultural College, ANGRAU, Tirupati-517502.
The present study was done to pesticides usage pattern of cotton farmers in Guntur district of Andhra Pradesh. Guntur
district ranks first in the production of cotton in the state. To conduct study two mandals were selected randomly, from which 100 cotton farmers were selected. The majority of the farmers were sourcing credit from the money lenders. Most of the farmer had smart phone for the communication. Greater percentage of farmers had 2.5-5 acres of land size. The mass media exposure was medium among the farmers group. Majority of the farmers were using pendimethalin 30% EC as herbicide, while monocrotophos 36% SL, acephate 75% SP as insecticides and carbendazim 12% + Mancozeb 63% WP as fungicide. The soluble liquids and solube powders were used maximum by the farmers.
KEYWORDS: Mass media, pesticides, money lenders, cotton farmers.
Pesticides are chemicals that are used to kill weeds, insects, and illnesses that may cause up to 50, 30 and 20 per cent, respectively, of damage to crops. These were manufactured or natural made. These substances were categorised as herbicides, fungicides, rodenticides, etc. based on their nature. According to the UN Food and Agriculture Organization, 40 per cent of crops in developing nations suffer damage from pests. Around 2 million tonnes of pesticides are used globally, of which herbicides account for 47.50 per cent of usage, insecticides for 29.50 per cent, fungicides for 17.5 per cent and other pesticides for 5.5 per cent. India accounted for 0.3 per cent of the global usage of pesticides with its 62193 metric tonnes of plant protection chemical use.
On an area of 6.06 lakh hectares, Andhra Pradesh produces the most cotton, generating 19 lakh bales. Uneven pesticide use has led to low pesticide use, which has reduced agricultural yields. However, spraying pesticides excessively can harm both humans and crops. To avoid crop losses, farmers must use pesticides at the optimum rate and at the appropriate time. To achieve good yields with minimal crop losses, farmers must be knowledgeable about the product’s usage, including the right pesticide to use, when to apply it, how to spray, etc.
The study helps to understand the pesticide usage pattern in cotton crop.
The survey was done in the Andhra Pradesh district of Guntur, which ranked first in pesticide consumption, land area, and cotton production in the state. Out of 58 mandals, two were chosen at random for the study. A total of 10 villages were created by randomly choosing five from each mandal. A sample size of 100 farmers was obtained by randomly choosing 10 from each hamlet. The study’s necessary information will be gathered from the farmers using a pre-tested timetable and numerous in-person visits.
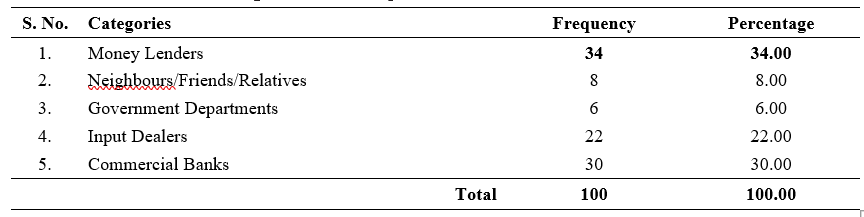
The data pertaining to the source of credit was collected and categorized into five categories namely money lenders, neighbors/friends/relatives, government departments, input dealers, and commercial banks. The data was collected and presented in Table 1.
The above Table 1, shows that among sample cotton farmers, 34 per cent of respondents were depended credit on money lenders, 30 per cent were depended on commercial banks, 22 per cent were depended on input dealers, 8 per cent were depended credit on friends/ neighbors, and 6 per cent were depended on government departments. It shows that the majority of sample cotton farmers depended credit on money lenders.
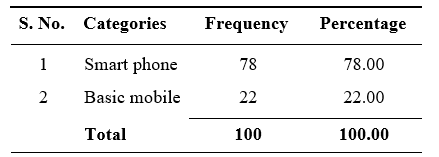
The data regarding mobile phone usage of sample cotton farmers was collected and classified into two groups namely smart phone and basic mobile. The data collected was analyzed and presented in Table 2.
A study of Table 2 shows that among sample cotton farmers, 78 per cent of sample cotton farmers had smart phones while 22 per cent of the sample cotton farmers had basic mobile for their daily communication and also for getting the information about production, marketing, post-harvest. This shows that majority of farmers were having smart phones.
The data regarding the Farm size of the sample cotton farmers was collected and categorized into seven groups namely no land, less than 1 acre, 1-2.5 acres, 2.5- 5 acres, 5-10 acres, 10-15 acres, and >15 acres. The data was collected and presented in Table 3.
From the above table 3, it reveals that 48 per cent of respondents were having land holdings between 2.5- 5 acres, 17 per cent growers were having land holding between 1-2.5 acres, likewise 16 per cent of farmers were having land holdings between 5-10 acres, 12 per cent respondents were having less than 1 acre of land,
4 per cent of respondents were having land holding between 10-15 acres of land and 3 per cent of respondents were having more than 15 acres of land. Thus, it may
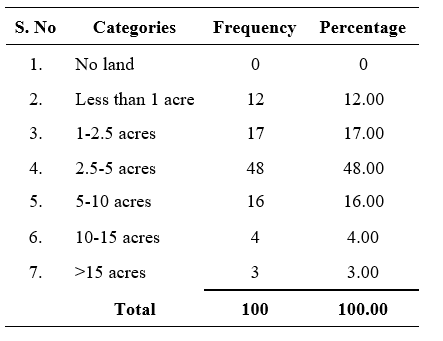
be concluded that the maximum percentage of cotton growers i.e. (48%) have landholding between 2.5-5 acres.
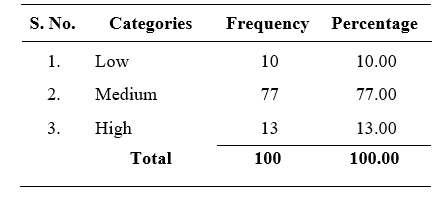
The data regarding mass media exposure of the sample cotton farmers were collected and grouped into three categories viz., low, medium, high. The collected data was analyzed and shown in Table 4.
From the Table 4, it shows that 77 per cent of respondents were having medium level of mass media exposure and 13 per cent of respondents were having high level of mass media exposure, 10 per cent of the respondents were having low level of mass media exposure. Thus, it can be concluded that majority (77 per cent) of the cotton growers were having medium level of mass media exposure.
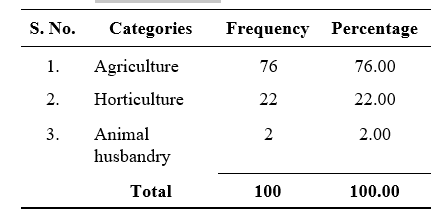
The data regarding the major occupations of sample farmers were collected and divided into three groups viz.,
Agriculture and Horticulture and Animal husbandry. The data collected was analyzed and presented in Table 5.
From the above Table 5, Agriculture was the major occupation for 76 per cent of the sample cotton farmers, horticulture was the major occupation for 22 per cent of the sample cotton farmers and only 2 per cent of the farmers were having animal husbandry as their major occupation. This infers that agriculture was the major occupation for most of the farmers.
To understand the pesticide usage pattern of cotton farmers, broadly divided into three categories namely herbicides, insecticides, fungicides. The data collected was analyzed and presented with following sub heads.
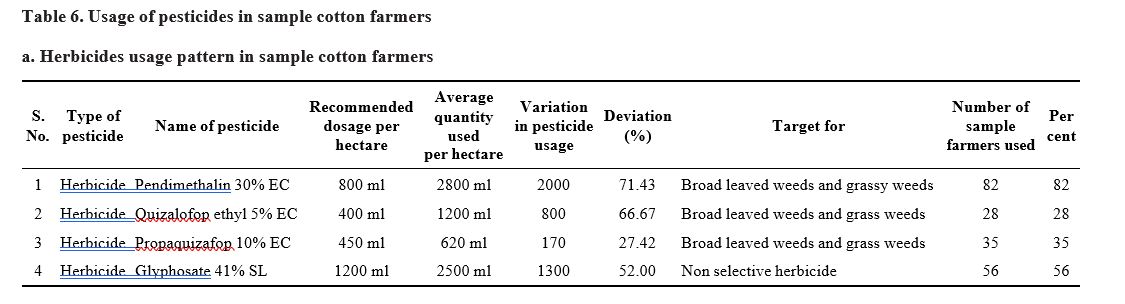
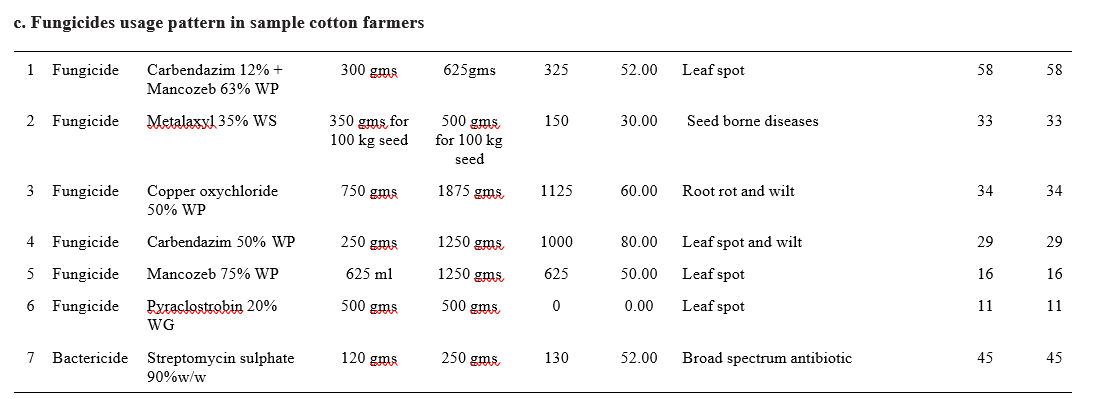
The information regarding pesticides to effectively control various weeds, pests, and diseases in the field was collected, analyzed and presented in Table 6.
From Table 6, it shows that the top two chemicals used by sample cotton farmers were Pendimethalin 30% EC, Glyphosite 40% SL which was used by 82 per cent, 56 per cent of the sample farmers respectively and The top three fungicides were Carbendazim 12% + Mancozeb 63% WP, Streptomycin sulphate 90% w/w, Copper oxychloride 50% WP used by 58 per cent, 45 per cent, 34 per cent of sample cotton farmers respectively. The least three fungicides used by the farmer were Carbendazim 50% WP, Mancozeb 75% WP, Pyraclostrobin 20% WG used by 29 per cent, 16 per cent, 11 per cent respectively by the sample cotton farmers.
Among herbicides the deviation was highest for pendimethalin 30% EC with 71.43 per cent and least for quizalofop ethyl 5% EC with deviation of 28 per cent of sample cotton farmers. Among insecticides the deviation was highest for 81.82 per cent Imidacloprid 17.8% SL, least deviation (negative) was Diafenthiuron 50% WP with -42.86 per cent.
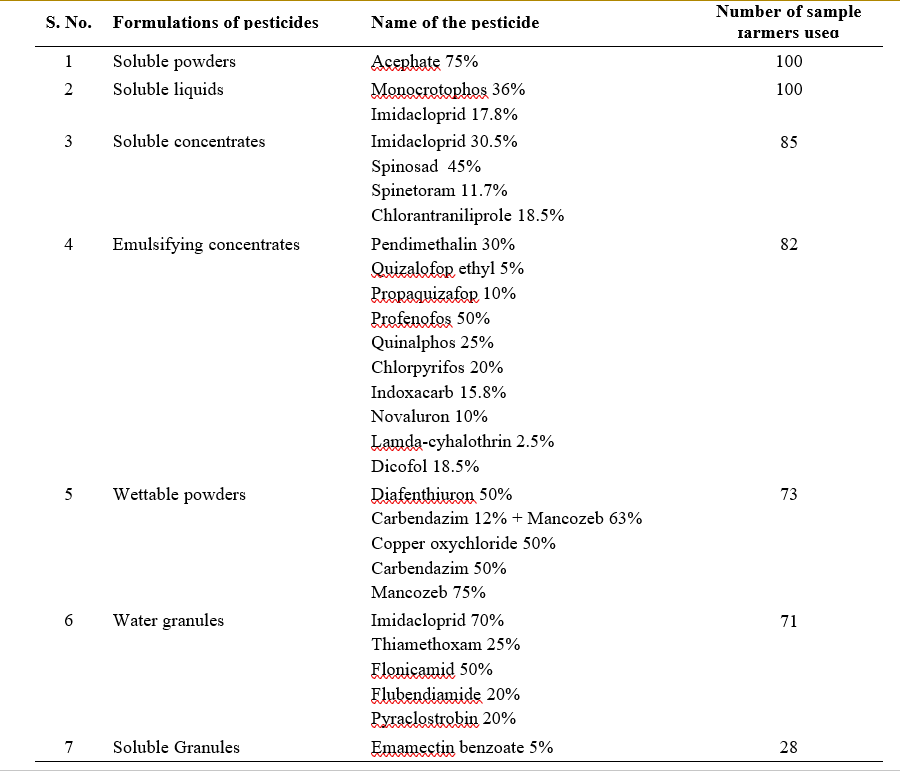
The data regarding the usage of pesticides according to the form pesticide was classifies as soluble powders, soluble liquids, soluble concentrates, emulsifying concentrates, wettable powders, water granules, soluble granules. The data was collected and presented in the below table.
From the table 7 it shows that 100 per cent of the sample were using soluble powders, soluble liquids as the form of pesticide, followed by 85 per cent of the sample farmers use emulsifying concentrates, 73 per cent of the sample farmers used wettable powders, 71 per cent of the sample farmers used water granules and 28 per cent of the sample farmers used soluble granules. This shows that majority of the farmers used soluble powders and soluble liquids form of pesticides.
Among herbicides the deviation was highest for pendimethalin 30% EC with 71.43 per cent and least for quizalofop ethyl 5% EC with deviation of 28 per cent of sample cotton farmers. Among insecticides the deviation was highest for 81.82 per cent Imidacloprid 17.8% SL, least deviation (negative) was Diafenthiuron 50% WP
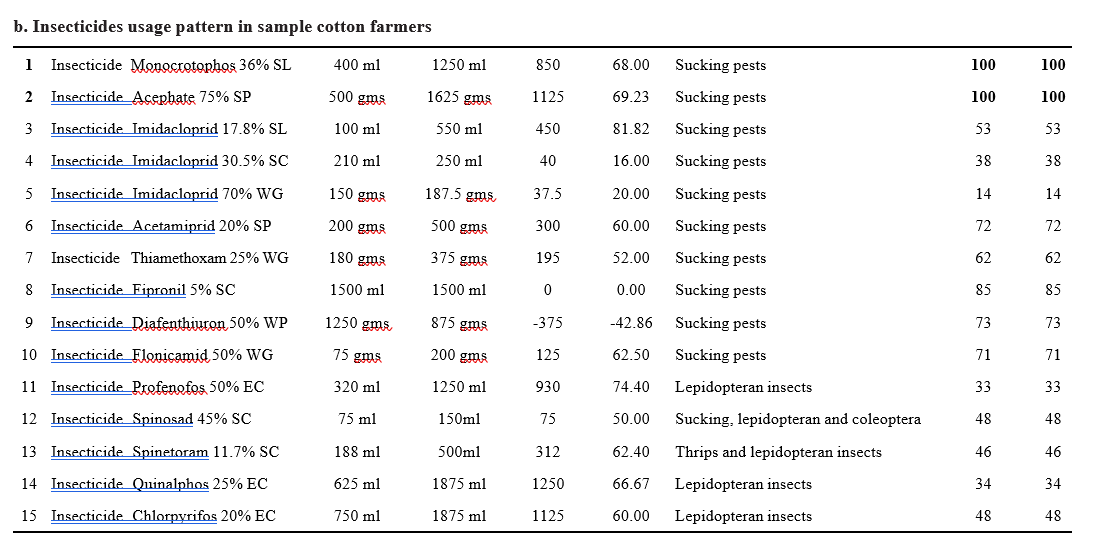
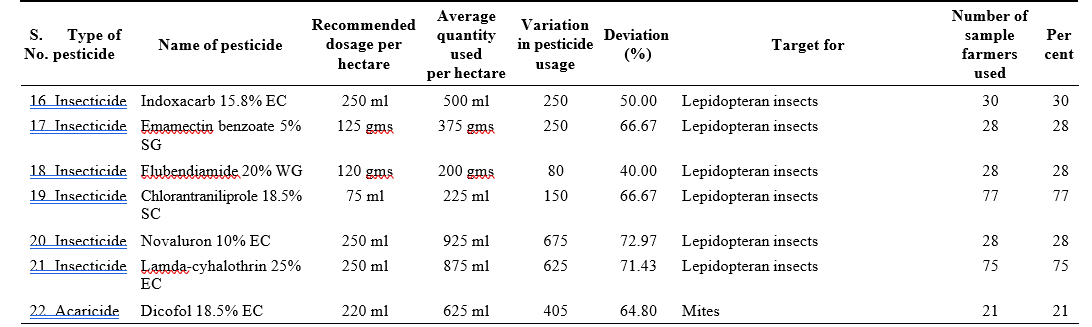
with -42.86 per cent. 100 per cent of farmers were using monocrotophos 36% SL and Acephate 75% SP. Majority of the farmers used soluble powders and soluble liquids form of pesticides.
Anil, K.B., Ragini, K., Padmasri, A., Jeevan, R.K and Shashibushan, V. 2017. Survey on pesticide usage pattern on bhendi. Bulletin of Environment, Pharmacology and Life Sciences. 6(1): 182-188.
Brar, G.S., Patyal, S.K., Dubey, J.K and Singh, G. 2018. Survey on pesticide use pattern and farmers perceptions in cauliflower and brinjal growing areas in three districts of Himachal Pradesh, India. International Journal of Current Microbiology and Applied Sciences. 7(3): 2417- 2423.
Deviprasad, A.G., Radha, S and Manonmani, H.K. 2015. Pesticide usage pattern in four districts of Karnataka: A survey. IOSR Journal of Environmental Science, Toxicology and Food Technology. 9(10): 48-51.