
0 Views
KENANAO NTSUAPE*, P. BALA HUSSAIN REDDY, S.V. PRASAD AND G. PRABHAKARA REDDY
Department of Agricultural Extension, S.V. Agricultural College, ANGRAU, Tirupati.
ABSTRACT
The study was conducted in two colleges of Acharya N.G. Ranga Agricultural University i.e. S.V. Agricultural College, Tirupati, Chittoor district and Agricultural College, Mahanandi, Kurnool district. To study the perception of students towards learning environment a total 120 respondents were randomly selected and data was collected using a structured interview schedule. The findings of the study revealed that majority (56.70) of the respondents belonged to the age of 21 years, 50.80 per cent were of female students, 77.50 per cent showed an excellent academic performance, 47.50 per cent participated in only one extracurricular activity, 41.70 per cent belonged to Open category, parents of 50.80 per cent had no possession of immovable assets, owned 3 or 4 movable assets (58.30%), 79.20 per cent had medium total annual income, 45.00 per cent of students with medium level of academic interest, resided in college hostel (96.70%), got their financial assistance from parents (45.83%), practiced both poor and good learning style(35.00%) and had neutral attitude towards the university (45.00%). Under perception towards learning environment factors majority of students strongly agreed to the statements viz., Students Cohesiveness: “I make friendship among students in college”, Teacher Support: “Professors talk with me”, Involvement: “I am asked to explain how I solve problems”, Task Orientation: “I try to understand the work in this class” and Cooperation: “I cooperate with other students when doing assignment work”.
KEYWORDS:
Perception, Students, Learning environment
Learning environment refers to the diverse physical locations, contexts, and cultures in which students learn. There is no single optimum learning environment, rather there is an infinite number of possible learning environments and that makes teaching and learning so interesting.Some of the components of a learning environment include: Student Cohesiveness, Teacher support, Involvement, Task orientation and Cooperation. Student cohesiveness means alliance among students in college. When there is good cohesion among students, they can alleviate each other as students understand and cope differently. Besides students being there for each other they can also use teachers support in learning.
Involvement means an act of participating or taking part in something. It has been proven that students tend to accumulate more knowledge when they are involved. In conjunction with involvement, task orientation can also be a form of motivation for learning. Task orientation means having focus on and devoted to completing certain tasks, especially those that contribute to the success of a main task. Cooperation is the action or process of working together to the same end. All the aspects of a learning environment correspond with each other to make a complete learning environment.
In the study, Exploratory research design was followed is conducted about a research problem when there are few or no earlier studies to refer to. The focus was on gaining insights and familiarity for later investigation or undertaken when problems are in a preliminary stage of investigation.
The state of Andhra Pradesh was selected purposively for the study. Rayalaseema region comprising of four districts viz., Kurnool, Chittoor, Anantapur and YSR Kadapa districts was purposively selected for the study. Two Agricultural colleges of Rayalaseema region i.e., S.V. Agricultural College, Tirupati, Chittoor district and Agricultural College, Mahanandi, Kurnool district were selected purposively for the study. After obtaining the total number of undergraduate students studying third year B.Sc. (Hons) Agriculture from both the selected agricultural colleges of a total of 120 students were selected following proportionate simple random sampling procedure. The data was collected by personal interview method through a structured interview schedule and analyzed by employing suitable statistical methods. Eleven independent variables were identified for the study.
1.Age
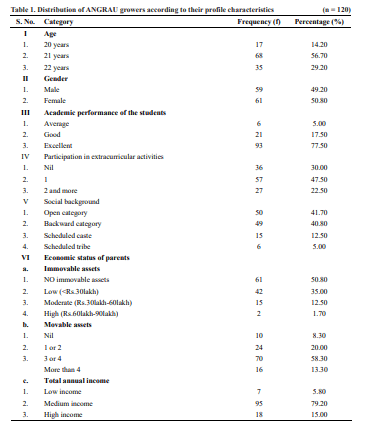
Table1 indicates that the majority i.e. 56.70 per cent respondents belonged to age group 21 years, followed by
29.20 per cent respondents who belonged to age group 22 years and the remaining 14.20 percent respondents were belonging to age group 20 years. These findings are in line with the work of Mlambo (2011), Wafaa and Safaa (2017).
It can be concluded that majority of the third year B.Sc. (Hons) Agriculture students had an age of 21 years. The possible reason is that after completion of intermediate, students joined, under graduation as per the chronology.
2.Gender
Table 1 clearly indicates that out of 120 respondents,
50.80 per cent of respondents were female students and the rest of respondents i.e. 49.20 per cent were male students. These findings are similar with the finding of Ebenuwa-Okoh (2010), Mlambo (2011) and David-Kacso et al. (2014).
This shows that the population of female students is slightly higher than male students. The possible reason may be in the recent times parents were giving importance to the education to all of their children irrespective of the sex. The possible reason for the finding is that girl students are more enthusiastic and focused in schoolwork, leading to better grades and marks in the entrance examinations and at all levels of study, as a result more of them are able to enroll in universities.
3.Academic Performance
Table 1 indicates that from 10th class through intermediate and to B.Sc. (Hons) Agriculture, majority (77.50%) of the respondents had an excellent academic performance followed by 17.50 per cent had good academic performance and 5.00 per cent of respondents had average performance. The findings are in line with the works of Patel (2005), Christian (2010) and Bhosale (2011).
The possible reason for the above finding is that students tend to put more effort into their schoolwork as they grow older, practical classes help them in remembering what they have been taught. Only the students who are meritorious will join the professional course like B.Sc. (Hons) Agriculture which is based on obtaining the rank at the state level entrance examination.
4.Participation in extracurricular activities
Table 1 indicates that majority (47.50%) of students participated in only one extracurricular activity followed by 30.00 per cent of students who did not take part in any extracurricular activity and 22.50 per cent students who participated in two extracurricular activities. The results are in line with the works of Sathyan (2008) and Aher (2010).
Some of the students felt that, as the number of extracurricular activities increase, students partaking decreases towards academics and education. This may be because in the semester system of the undergraduate programme there is limited amount of time to the students to participate more in the extracurricular activities, also that time is used for attending to assignments, record writing and other works as the number of credits registered in the undergraduate programmes went on increasing time to time. Improper time management could be another reason for the results above.
5.Social background
It is evident in Table 1 that majority (41.70%) of students belong to Open Category followed by Backward Category which is slightly lower by 40.80 per cent of students, then the third position is Scheduled Caste with
12.50 per cent and lastly Scheduled Tribe by 5.00 per cent. The findings find support from the works of Bhosale (2011) and Verma (2014).
From the results it is clear that the majority of students belong to Open Category. The possible reason is that social background of the students is in accordance with admission procedures at the time of counselling at the university and as the rules governing reservations of seats which is being followed by Acharya N.G. Ranga Agricultural University.
6.Economic status of parents
i.Immovable assets
Immovable assets are those assets that cannot be moved from one place to another, they are also called as fixed assets. Mostly owning immovable assets is costly. These immovable assets include land, house, etc. According to Table 1 majority (50.80%) of student parents had no immovable assets, followed by 35.00 per cent low possession, 12.50 per cent moderate possession and 1.70 per cent high possession.
It can be concluded that, immovable assets possession ranges between nil to low. This is probably because most students come from families of medium income and farmer quota. The students from the rich families might have taken seats in still higher professional courses like medicine on payment basis.
ii.Movable assets
A movable asset is any property that can be moved from one location to another. The movable assets which were included in the study are Car, Television, Refrigerator, Air conditioner, Music system, Two-wheeler and others. The was analysed based on number of movable assets students’ parents possess. The results in Table 1 indicates that majority (58.30%) of students’ parents owned 3 or 4 movable assets followed by 20.00 per cent who owned 1 or 2 movable assets, 13.30 per cent owned more than 4 movable assets and 8.30 per cent owned no movable asset.
It was observed that a movable asset which was owned by most families was television followed by two- wheeler, refrigerator, air conditioner then music system. This might be due to the probable reason that families prioritize when it comes to movable asset ownership i.e., they buy the most convenient assets. Other movable assets which were mentioned are tractors, sewing machines and tractor drawn water tank. The possible reason is that the families buy movable assets based on whether they are essential.
iii.Total Annual income
Parents’ annual income was categorized into three categories i.e. Low income, Medium income and High income. According to Table 1 majority (79.20%) of parents had medium income followed by high income (15.00%) and low income (5.80%) levels. The findings are evident with the findings of Shingwan (2002) and Gadhvi (2012).
Therefore, it can be concluded that majority of parents of students had medium to high annual income. The possible reason for this is that some families have more than one source of income.
7.Academic interest
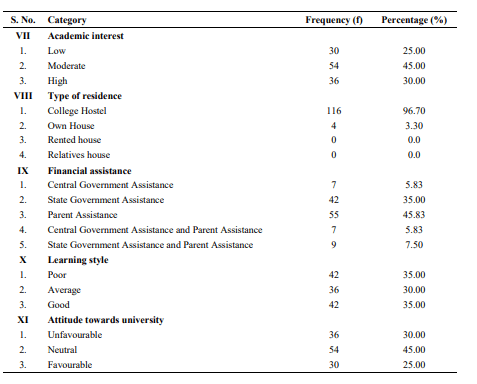
From Table 1 it is shown that majority (45.00%) of third year B.Sc. (Hons) Agriculture undergraduate students had medium level of academic interest followed by high level (30.00%) and low level (25.00%) of academic interest. It can be concluded that students had medium to high level of academic interest.
8.Type of residence
The distribution of respondents according to where they resided while at college is presented in Table 1. It is evident from the data that majority (96.70%) of students resided in college hostel while they were at college followed by 3.30 per cent of students who stayed at their own house. None of the students stayed at a rented house or at relatives’ house.
It can be concluded that students resided in hostel because their native places are far from colleges, hence it is difficult to commute also other students want to get help easily from their classmates in hostel. The other reason is that staying at hostel is cheaper as compared to other accommodations.
9.Financial assistance
Financial assistance was divided into 5 categories viz. Central Government Assistance, State Government Assistance, Parent Assistance, Central Government Assistance & Parent Assistance and State Government Assistance & Parent Assistance. It is apparent from Table 1 that majority (45.83%) of the respondents got their financial assistance from Parents followed by 35 per cent of students who got their financial assistance from State Government, 7.50 per cent of students who got their financial assistance from both State Government and Parents, 5.83 per cent of Central Government and 5.83 per cent from both Central Government and parents.
It can be concluded that majority of students got financial assistance from their parents. The possible reason for the findings is that Central and State Government gives few scholarships to undergraduate students.
10. Learning style
Results presented in Table 1 clearly shows that both poor and good learning style was practiced by 35.00% of the students followed by average learning style at 30.0 per cent.
The results show that the learning style practiced by students is spread out through the three categories. The results are due to the fact that students have different methods they use to study.
11. Attitude towards university
It is clear in Table 1 that when it comes to attitude towards university, majority of students i.e. 45 per cent of the students had neutral attitude towards the university, followed by unfavourable at 30 per cent and favourable
attitude at 25.0 per cent. The results show that students have neutral to unfavourable attitude towards the university.
Perception towards learning environment
1.Student Cohesiveness
The results on student cohesiveness highlighted that the students strongly agreed and agreed with the given statement in this order: “I make friendship among students in college”, “I am friendly to other students”, “I know other students in my college”, “I get help from other students”, “I work well with other class members” and “Students in this college like me”.
Student cohesiveness has to do with the idea of creating a bond amongst students, so it can be concluded
that there is a strong bond amongst students and this might be due to the provision of accommodation facility in the form of a hostel to students by the university. When students spend so much time with each other the strength of the bond increases, also students are given group assignments all the time hence working together strengthens the bond, extracurricular activities contribute to student cohesiveness.
2.Teacher Support
The distribution of respondents according to their perception on Teacher Support indicated that majority of students agreed and strongly agreed that professors help students when they have trouble with the work followed “Professors talk with me”, “Professors’ questions help me to understand”, “Professors go out of their way to help students”, “Professors consider students’ feelings”, “Professors take a personal interest in all students” and “Professors are interested in my problems”.
It can be concluded that all the statements had a score between average and above average. The professors support is thus due to the fact that ratio of professor to students is a bit high so this makes it hard for professors to create time to for one on one sessions with students.
3.Involvement
The results of students perception on their involvement indicated that majority of the students agreed and strongly agreed on the statement: “I am asked to explain how I solve problems” followed by “Students discuss with me how to go about solving problems”, “The professors ask me questions”, “I explain my ideas to other students”, “I discuss ideas in classes”, “I give my opinions during class discussions”, “My ideas and suggestions are used during classroom discussions” and “I ask the professors questions”.
The results above might be due to the fact that students lack confidence so that is stopping them from contributing during classes, also students do not pay attention in class.
4.Task Orientation
The results of students’ perception on their task orientation revealed that majority of students agreed and strongly agreed to “I try to understand the work in this class” followed by “I know how much work I have to do”, “Getting a certain amount of work done is important to me” and “I know what I am trying to accomplish”. All the given statements had a majority score of between average and above average.
The probable reason is that students help each other in tackling assignments given in class, library has a variety of learning materials for reference and professors are always willing to assist students.
5.Cooperation
The results of students’ perception on their cooperation revealed that majority of the students agreed and strongly agree in “I cooperate with other students when doing assignment work”, “I share my books and resources with other students when doing assignments”, “There is teamwork whenever we are given group work”, “I work with other students on projects”, “I learn from other students in college”, “I work with other students in class” and “Students work with me to achieve class goals”.
It can be noticed that the all the given statements yielded majority of agreed and strongly agreed. The possible reason for the findings is that there is strong bond amongst students and they like helping each other in getting their goals to be achieved.
Perception towards learning environment
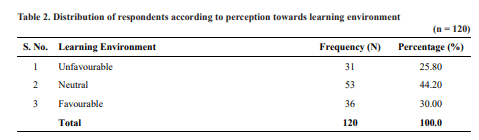
The results in Table 2 shows that 44.20 per cent of students had a neutral perception towards learning environment followed by 30.00 per cent of students who had a favourable perception towards learning environment and 25.80 per cent of students had an unfavourable perception towards learning environment. The findings of the study are in line with the work of Pai et al. (2014).
Study revealed that majority of the respondents belonged to the age of 21 years, showed an excellent academic performance, with medium level of academic interest, resided in college hostel, got their financial assistance from parents, practiced both poor and good learning style and had neutral attitude towards the university
Under perception towards learning environment factors majority of students strongly agreed to the statements viz., Students Cohesiveness: “I make friendship among students in college”, Teacher Support: “Professors talk with me”, Involvement: “I am asked to explain how I solve problems”, Task Orientation: “I try to understand the work in this class” and Cooperation: “I cooperate with other students when doing assignment work”.
Aher, M.C. 2010. Entrepreneurial attitude of agricultural students. M.Sc. (Ag.) Thesis. Anand Agricultural University, Anand, India.
Bhosale, R.S. 2011. Computer proximity of women research scholars of SAUs of Gujarat. Ph.D. Thesis. Anand Agricultural University, Anand, India.
Christian, B.M. 2010. Computer proximity of women research scholars of SAUs of Gujarat. Ph.D. Thesis. Anand Agric University, Anand, India.
David-Kacso, A. Haragus, P.T and Roth, M. 2014. Peer influences, learning experiences and aspirations of Romanian high school students in their final school year. Procedia-Social and Behavioral Sciences. 141: 200-204.
Ebenuwa-Okoh, E.E. 2010. Influence of Age, Financial Status, and Gender on Academic Performance among Undergraduates. Journal of Psychology. 1(2): 99-
103.
Gadhvi, B.G. 2012. Study on Agribusiness Anxiety of Postgraduate Students of State Agricultural Universities of Gujarat. Unpublished M.Sc. (Ag.) Thesis. Anand Agricultural University, Anand, India.
Mlambo, V. 2011. An analysis of some factors affecting student academic performance in an introductory biochemistry course at the University of the West Indies. Carribean Teaching Scholar. 1: 79-92.
Pai, P.G., Menezes, V., Srikanth, Subramanian, A.M and Shenoy, J.P. 2014. Medical students’ perception of their educational environment. Journal of Clinical and Diagnostic Research. 8: 103-107.
Patel, V.B. 2005. A study of attitude and occupational aspiration of B.Tech dairy science students of Gujarat state. M.Sc. (Ag.) Thesis. Anand Agricultural University, Anand, India.
Sathyan, K. 2008. Learning styles of agriculture students.
M.Sc. Thesis. M.A.U., Parbhani, Maharashtra, India.
Shigwan, A.S. 2002. A study on aspiration of the boys of the college of agriculture Dapoli. M.Sc. (Ag.) Thesis. Dr. BSKKV, Dapoli, India.
Verma, S. 2014. Women in Higher Education in Globalised India: The Travails of inclusiveness and social equality. Social Change. 44(3): 371–400.
Wafaa, Y.A.W and Safaa, K.H. 2017. Prevalence and associated factors of stress, anxiety and depression among medical Fayoum University students. Alexandria Journal of Medicine. 53: 77-84.