
0 Views
Department of Genetics and Plant Breeding, S.V. Agricultural College, ANGRAU, Tirupati-517 502.
In the present study, analysis of variance for 60 rice genotypes revealed significant differences among the genotypes for 15 yield and yield attributes indicating the presence of considerable amount of genetic variability among the rice genotypes. Higher estimates of PCV and GCV observed for number of chaffy grains panicle-1, number of filled grains panicle-1, number of spikelets panicle-1, grain yield plant-1 and thousand grain weight showed ample amount of variation for these traits. High heritability coupled with high genetic advance as per cent of mean was observed for days to 50% flowering, days to maturity, thousand grain weight, number of chaffy grains panicle-1, grain L/B ratio, grain width, plant height, number of spikelets panicle-1, number of filled grains panicle-1 and grain yield plant-1 indicating the predominance of additive gene action and direct selection would be effective for improvement of these traits.
KEYWORDS: PCV, GCV, Heritability, Genetic Advance.
Rice (Oryza sativa L.) is a widely grown crop, staple food and major calorie source for over 3 billion people on the earth. It occupies a pivotal place in Indian agriculture as it is a staple food for more than 70% of population and source of livelihood for about 150 million rural households (Devi et al. 2022).
Globally rice is cultivated in 164.19 million hectares of area with production of 756 million tonnes (FAO, 2020). In India, rice is grown around in 45.07 million hectares with a production of 122.27 million tonnes of grains (Directorate of Economics and Statistics, 2021). In Andhra Pradesh, rice is a major crop cultivated in 2.55 million hectares with a production of 13.08 million tonnes annually with a productivity of 5.13 tonnes hectare-1 (Directorate of Economics and Statistics, 2021).
Exploiting existing genetic variability in the population is the principle behind every successful crop improvement programme. Presence of adequate genetic variability provides an opportunity for plant breeder to select desirable genotypes for hybridization. Assessment of heritability is useful in defining genetic relationship between parents and progeny and to understand the characters that are under genetic control. Heritability estimates accompanied with genetic advance is useful in measuring genetic gain under selection, to predict genetic advance of the trait and also to formulate suitable selection procedure.
For yield improvement in any crop, it is essential to develop genetically stable genotypes having high yield potential. It is therefore, necessary to estimate relative amounts of genetic and non-genetic variability exhibited by different characters using suitable parameters like genotypic coefficient of variation (GCV), phenotypic coefficient of variation (PCV) heritability (h2 ) and genetic advance.
The present investigation was conducted to elucidate the information regarding variability, heritability and genetic advance in promising rice genotypes.
The present investigation was carried out during kharif 2021 at Wetland Farm, S.V. Agricultural College, Tirupati, Chittoor District, Andhra Pradesh, India, located at geographical co-ordinates of 13°54’ N latitude and 79°54’ E longitude, and 182.9 m altitude. Experiment was laid out in randomized block design with two replications. In each replication, every genotype was transplanted in two rows of two meters length with a spacing of 20 cm × 15 cm. All the recommended package of practices were adopted during entire crop season to raise healthy crop. Observations were recorded for 15 yield and yield attributing characters. Data was subjected to statistical analysis for assessing phenotypic and genotypic coefficient of variation (Burton, 1952), heritability (Allard, 1960) and genetic advance as percent of mean (Johnson et al., 1955).
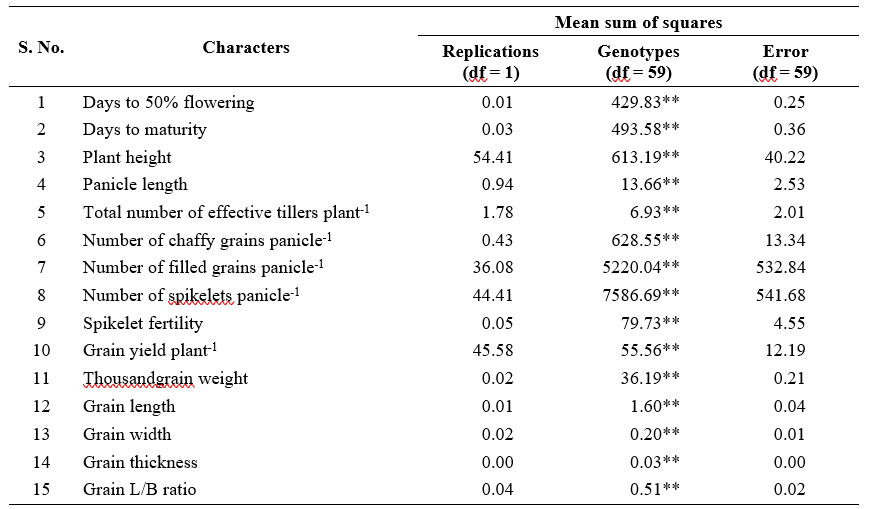
Analysis of variance revealed significant differences among genotypes for all the 15 yield and yield attributing characters indicating the presence of sufficient genetic variability among the genotypes (Table 1). Phenotypic coefficient of variance (PCV) was slightly higher than genotypic coefficient of variance (GCV) for the traits studied indicating less interaction of traits with environment (Table 2).
High estimates of GCV and PCV were observed for number of chaffy grains panicle-1 (GCV = 44.37 %; PCV = 45.32 %), number of spikelets panicle-1 (GCV = 26.53%; PCV = 28.50%), number of filled grains panicle-1 (GCV = 26.29%; PCV = 29.12%), grain yield plant-1 (GCV = 23.81%; PCV = 29.76%) and thousand grain weight (GCV = 20.20%; PCV = 220.32%). This indicated the presence of extensive inherent variability in these traits remain unaltered by environmental conditions among the genotypes, which in turn was more useful for exploitation in selection.
Similarly, high estimates of GCV and PCV were reported by Lakshmi et al. (2021), Singh et al. (2021) and Saha et al.(2019) for number of chaffy grains panicle-1; Singh et al. (2022) and Saha et al. (2019) for number of spikelets panicle-1; Devi et al. (2022), Gupta et al. (2022), Singh et al. (2022), Lakshmi et al. (2021), Singh et al. (2021) and Saha et al. (2019) for number of filled grain panicle-1; Devi et al. (2022), Gupta et al. (2022), Bhargaviet al. (2021), Lakshmi et al. (2021), Singh et al. (2021) and Saha et al.(2019) for grain yield plant-1; Devi et al. (2022), Bhargavi et al. (2021) and Saha et al. (2019) for thousand grain weight.
Grain L/B ratio (GCV = 15.10%; PCV = 15.59%),
days to 50% flowering (GCV = 14.78%; PCV = 14.79%), plant height (GCV = 14.18%; PCV = 15.14%), days to maturity (GCV = 12.34%; PCV = 12.35%) and grain width (GCV = 11.41%; PCV = 11.84%) had moderate values for GCV and PCV. While, number of effective tillers plant-1 had moderate GCV (17.93%) and high PCV (24.17%). This indicated the existence of sufficient variability for attempting selection to improve these traits in the genotypes studied. These findings were in consonance with Gupta et al. (2022), Priyanka et al. (2020) for grain L/B ratio; Gupta et al. (2022), Singh et al. (2022), Lakshmi et al. (2021), Singh et al. (2021), Sudeepthi et al. (2020) and Dhavaleswar et al. (2019) for plant height and Bhargavi et al. (2021) and Lakshmi et al. (2021) for days to 50% flowering.
Low estimates of GCV and PCV were recorded for spikelet fertility % (GCV = 7.46%; PCV = 7.90%), grain thickness (GCV = 7.09%; PCV = 7.35%), indicating narrow range of variability for these traits there by restricting the scope of simple selection. Similar kind of low estimates of variability was also reported by Sudeepthi et al. (2020) Swapnil et al. (2020) and Dhavaleshvar et al. (2019) for spikelet fertility %. While, grain length (GCV = 9.93%; PCV = 10.20%) and Panicle length (GCV = 9.17%; PCV = 11.05%) had low GCV and moderate PCV estimates which was supported by findings of Bhargavi et al. (2021) and Lakshmi et al. (2021) for panicle length.
High heritability was observed for all the characters except number of effective tillers plant-1 (55.00%) which registered moderate heritability. Days to 50% flowering and days to maturity had highest heritability value (99.90%) followed by thousand grain weight (98.90%), number of chaffy grains panicle-1 (95.80%), grain length (94.80%), grain L/B ratio (93.70%), grain width (92.90%), grain thickness (92.90%), spikelet fertility % (89.20%), plant height (87.70%), number of spikelets panicle-1 (86.70%), number of filled grains panicle-1 (81.50%), panicle length (68.80%) and grain yield plant-1 (64.00%).These characters can serve as effective selection parameters during breeding programmes for the improvement of productivity. Simple selection based on per se performance is effective for improving the performance of these characters.
Likewise, high estimates of heritability were reported by Devi et al. (2022) and Bhargavi et al. (2021) for days to 50% flowering, thousand grain weight and grain yield plant-1; Gupta et al. (2022) and Bhargavi et al. (2021) for both days to maturity and grain L/B ratio; Lakshmi et al. (2021), Singh et al. (2021) and Saha et al. (2019) for both number of chaffy grains panicle-1 and plant height; Bhargavi et al. (2021) for both grain length and grain width; Singh et al. (2022), Swapnil et al.

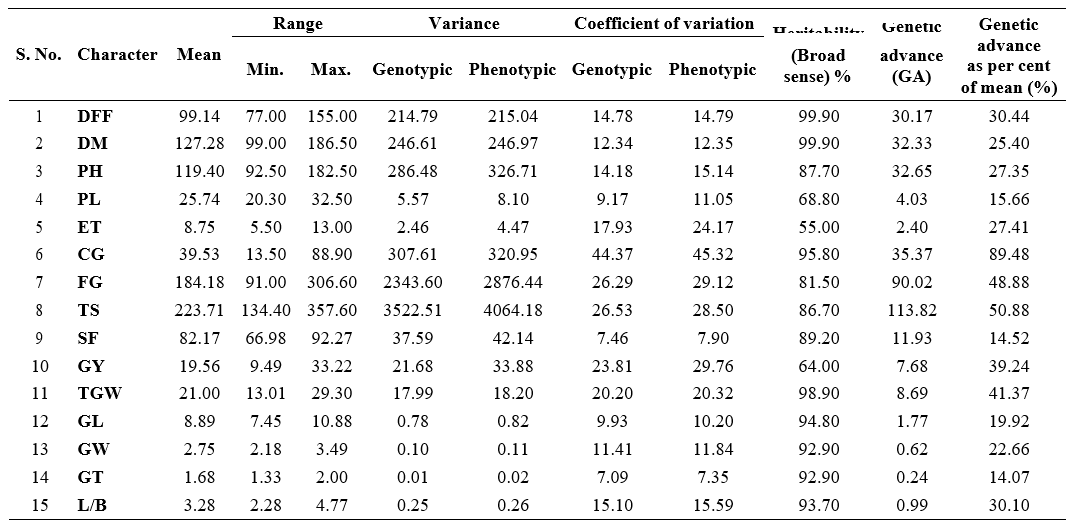
DFF : Days to 50% flowering; CG : Number of chaffy grains panicle-1; TGW : Thousand grain weight (g); DM : Days to maturity; FG : Number of filled grains panicle-1; GL : Grain length (mm); PH : Plant height (cm); TS : Number of spikelets panicle-1; GW : Grain width (mm); PL : Panicle length (cm); SF : Spikelet fertility (%); GT : Grain thickness (mm); ET : Total number of effective tillers plant-1; GY : Grain yield plant-1 (g); L/B : Grain L/B ratio
A similar kind of results for high heritability coupled with high genetic advance was earlier reported by Devi et al. (2022), Bhargavi et al. (2021) and Lakshmi et al.(2021) for days to 50% flowering, grain yield plant-1, thousand grain weight; Lakshmi et al. (2021), Singh et al. (2021) and Sahaet al. (2019) for number of chaffy grains panicle-1 and number of filled grains panicle-1; Singh et al. (2022) and Saha et al. (2019) for number of spikelets panicle-1; Singh et al. (2022), Lakshmi et al. (2021) and Dhavaleswar et al. (2019) for plant height; Gupta et al. (2022) and Bhargavi et al. (2021) for grain L/B ratio.
These results were in accordance with Bhargavi et al. (2021) and Saha et al. (2019) for panicle length; Bhargavi et al. (2021) for grain length and Sudeepthi et al. (2022) for spikelet fertility.
Number of effective tillers plant-1 showed moderate heritability and high genetic advance as per cent of mean (h2bs = 55.00%; GAM = 27.41%). It shows the presence of additive gene action. Hence, selection may be effective for the improvement of this character.
From the foregoing discussion, it was evident that number of chaffy grains panicle-1, number of filled grains panicle-1, number of spikelets panicle-1, grain yield plant-1 and thousand grain weight exhibited sufficient variation among genotypes and hence direct selection may be effective for these characters. PCV is greater than GCV for all these characters which indicates less influence of environment on expression of traits.
High heritability coupled with high genetic advance as per cent of mean was recorded in number of days to 50% flowering, days to maturity, thousand grain weight, number of chaffy grains panicle-1, grain L/B ratio, grain width, plant height, number of spikelets panicle-1, number of filled grains panicle-1 and grain yield plant-1. It indicates the presence of additive gene action in inheritance of these characters and the influence of environment is less on expression of these characters. Early and simple selection could be exercised due to fixable additive gene effects observed for yield and its components in the present study material.
Agriculture Statistics at a Glance. 2020-21. Directorate of Economics and Statistics, Department of Planning, Government of Andhra Pradesh, Vijayawada.
Allard, R.W. 1960. Principles of Plant Breeding. John Wiley and Sons. Inc., New York.
Bhargavi, M., Shanthi, P., Reddy, V.L.N., Reddy,
D.M and Reddy, B.R. 2021. Estimates of genetic variability, heritability and genetic advance for grain yield and other yield attributing traits in rice (Oryza sativa L.). The Pharma Innovation Journal. 10(5): 507-511.
Burton, G.W. 1952. Quantitative inheritance in grasses. Proceedings of Sixth International Grassland Congress. 1: 277-283.
Devi, K. R., Hari, Y., Chandra, B. S and Prasad, K. R. 2022. Genetic Association, Variability and Path Studies for Yield Components and Quality Traits of High Yielding Rice (Oryza sativa L.) Genotypes. International Journal of Bio-Resource and Stress Management. 13(1): 81–92.
Dhavaleshvar, M., Malleshappa, C and Kumar, B.M.D. 2019. Variability, correlation and path analysis studies of yield and yield attributing traits in advanced breeding lines of rice (Oryza sativa L.). International Journal of Pure and Applied Biosciences. 7(1): 267-273.
FAO (Food and Agriculture Organization), 2019-20. FAOSTAT Database. FAO, Rome. www.faostat. fao.org.
Gupta, H., Purushottam, Yadav, G., Yadav, S.K., Singh, S and Kumar, S. 2022. Genetic variability, heritability and genetic advance for yield and its related traits in rainfed upland rice (Oryza sativa L.) genotypes. The Pharma Innovation Journal. 11(2): 2520-2524.
Johnson, H.W., Robinson, H.F and Comstock, R.E. 1955. Estimation of genetic and environmental variability in soybean. Agronomy Journal. 47(3): 314-318.
Lakshmi, M. S., Suneetha, Y and Srinivas, T. 2021a. Genetic variability, correlation and path analysis for grain yield and yield components in rice genotypes. Journal of Pharmacognosy and Phytochemistry. 10(1): 1369–1372.