
0 Views
Department of Genetics and Plant Breeding, S.V. Agricultural College, ANGRAU, Tirupati-517 502.
To discriminate maize inbred lines based on yield traits using D2 statistics and principal component analysis (PCA), sixty four genotypes available at Department of Genetics and Plant breeding, Agriculture Research Station, Peddapuram, Andhra Pradesh were tested during Rabi, 2023-24 under irrigation condition in Alpha lattice design with two replications. Analysis of variance revealed significant differences for 14 characters studied among the genotypes. The D2 statistics displayed that cluster II, being largest group, comprises 37 maize genotypes followed by cluster I (15), III (10), IV (1) and V (1). The maximum intra- cluster distance was obtained for cluster I (99.05) while cluster IV and V showed null values as they were monogenetic clusters. Furthermore, maximum inter-cluster distance was recorded between cluster V and IV (2342.19) followed by clusters I and IV (2038.71) and clusters V and III (1391.95). D2 statistics and principal component analysis (PCA) emphasized that days to 50 per cent anthesis, plant height, ear height, 100- kernel weight, shelling percentage, number of kernels row⁻¹, and number of kernel rows ear⁻¹ and kernel yield plant⁻¹ were major contributing traits for total genetic diversity. Research results indicated that the inbreds under study are highly diversified and hence, high heterotic hybrids would be resulted through the crossing of diverse lines clubbed under different clusters as parent in any breeding programme aimed to enhance grain yield.
KEYWORDS: Genetic diversity, Inbred lines, D2 stastic, Yield traits, Principal component analysis.
Maize (Zea mays L.) is a diploid plant species with a chromosome number of 20 (2n=20), ranking as one of the world’s most important cereal crops, alongside rice and wheat. It belongs to the family Poaceae, the subfamily Panicoideae, and the tribe Maydeae. Archaeological and molecular evidence indicates that modern maize was domesticated from annual teosinte (Zea mays ssp. Parviglumis) in southern Mexico between 6,600 and 9,000 years ago (IIMR, 2023). Known as the “Queen of Cereals,” maize boasts the highest yield potential among all cereals. It is a versatile crop with wide genetic variability, capable of thriving in tropical, subtropical, and temperate agro-climatic conditions worldwide.
Global maize production reached approximately 1.21 billion tonnes in 2023. The United States led the production with an estimated production of 384 mt, makin gi tth eto pproduce rworldwide .Othe rmajo rmaize- producing countries are China, Brazil, and Argentina. India has been among the top 10 maize producers in the world since 1961, and currently ranks 5th (FAO 2023) and 14th largest exporter of Maize in the world (UN- COMTRADE data, 2022), contributing around 38.09 mt in 2023. Andhra Pradesh produced approximately 4.14 mt of maize, with an area under cultivation of around 2.6 lakh hectares. This accounted for about 11.5% of India’s total maize production, which was around 33 m t (APSSDC, 2023).
The hybrid seed industry utilizes maize inbred lines selectively, depending on the availability of lines from diverse source populations and gene pools, while evaluating their individual performance and hybrid potential. Comprehensive understanding of genetic diversity among genotypes is critical for selecting parents in hybridization programs, particularly in cross- pollinated crops like maize.
Grai nyield, acomple xquantitativ etrait, result sfrom the interplay of key processes such as photosynthesis, transpiration, and food storage (Naushad et al., 2007), alongside the coordinated contribution of traits like the number of kernels per plant, number of kernel rows per ear, number of kernels per row, and 100-kernel weight (Viola et al., 2003). Significant genetic variability, which reflects heritable differences among cultivars, is essential to ensure the effectiveness and longevity of plant breeding programs. Advanced biometrical techniques, such as multivariate analysis (Rao, 1952) Observations on various parameters were recorded using Mahalanobis’ (1936) D² statistics and principalfor three plants selected at random from each entry in component analysis (PCA) (Pearson, 1901), have made each replication except for days to 50% anthesis, days to it possible to quantify and assess the genetic diversity 50% silking, anthesis silking interval were recorded on within germplasm. This study focused on distinguishing plot basis. maize inbred lines based on yield and yield contributing traits using D² statistics and PCA.
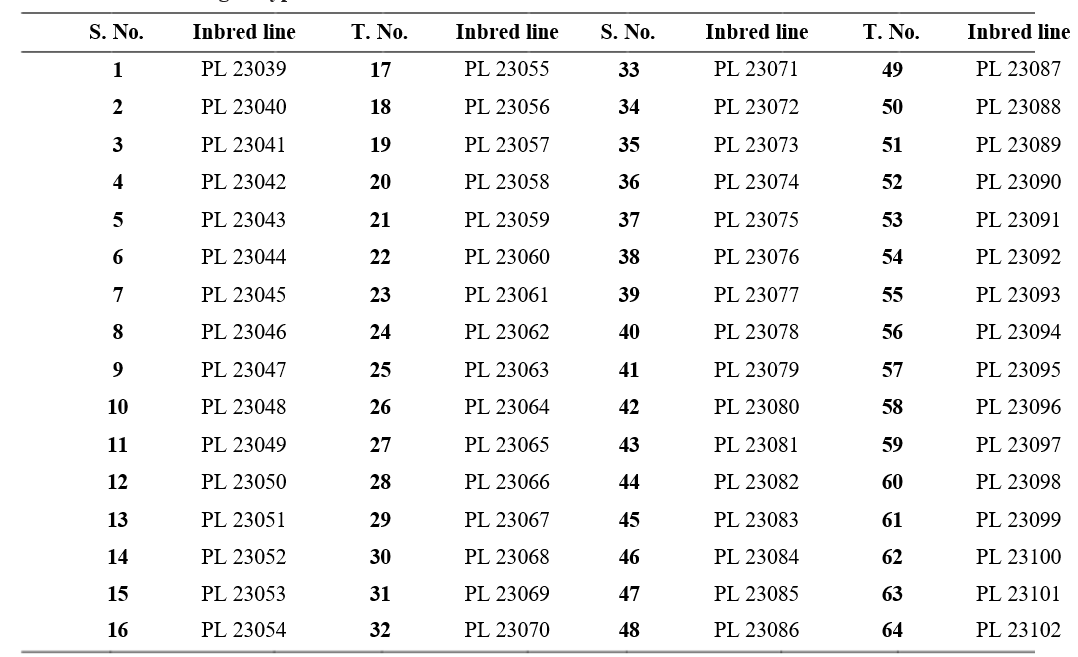
The study was conducted at Agricultural Research Station, Peddapuram, Andhra Pradesh during Rabi 2023-24 under irrigated conditions. The experiment was laid out in Alpha Lattice design. The experimental material used in the present study consisted of 64 maize inbred lines developed at ARS, Peddapuram. The entire experimental area was divided into two replications, each comprising (64 of 8) = 8 blocks. Within each block, eight inbred lines were allocated. Each inbred line was planted in two rows, each spanning 4 meters in length, with a spacing of 60cm between rows and 20cm within the rows.
Statistical analysis of genetic divergence was computed by using D2 statistics of Mahalanobis (1936), and clustering of genotypes was done according to Tocher’s optimization method as described by Rao (1952). Relative contribution of characters towards genetic divergence was calculated as per the guideline of Singh and Chaudhary (1985). The principal component analysis was done as described by Pearson (1901).
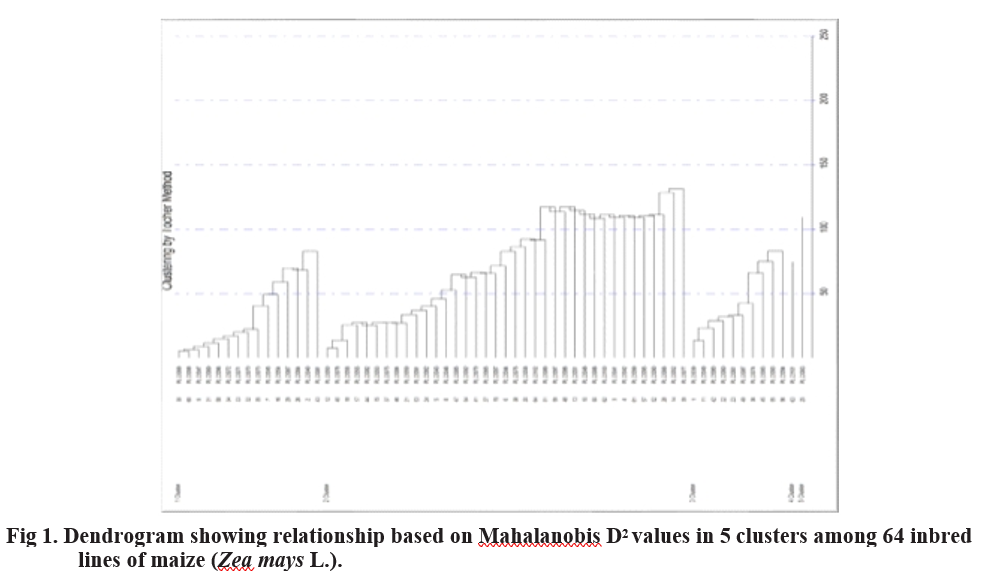
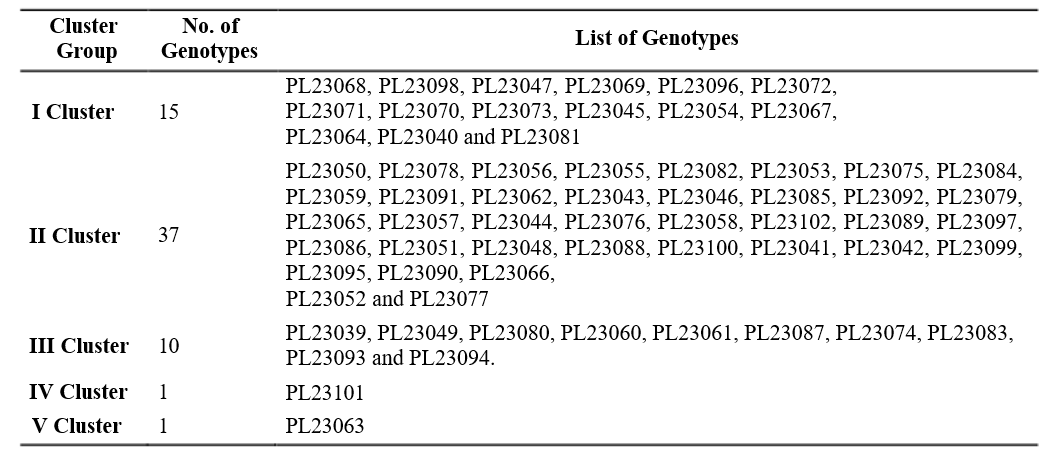
The 64 inbred lines were grouped into five clusters by using Tocher’s method. The distribution of inbred
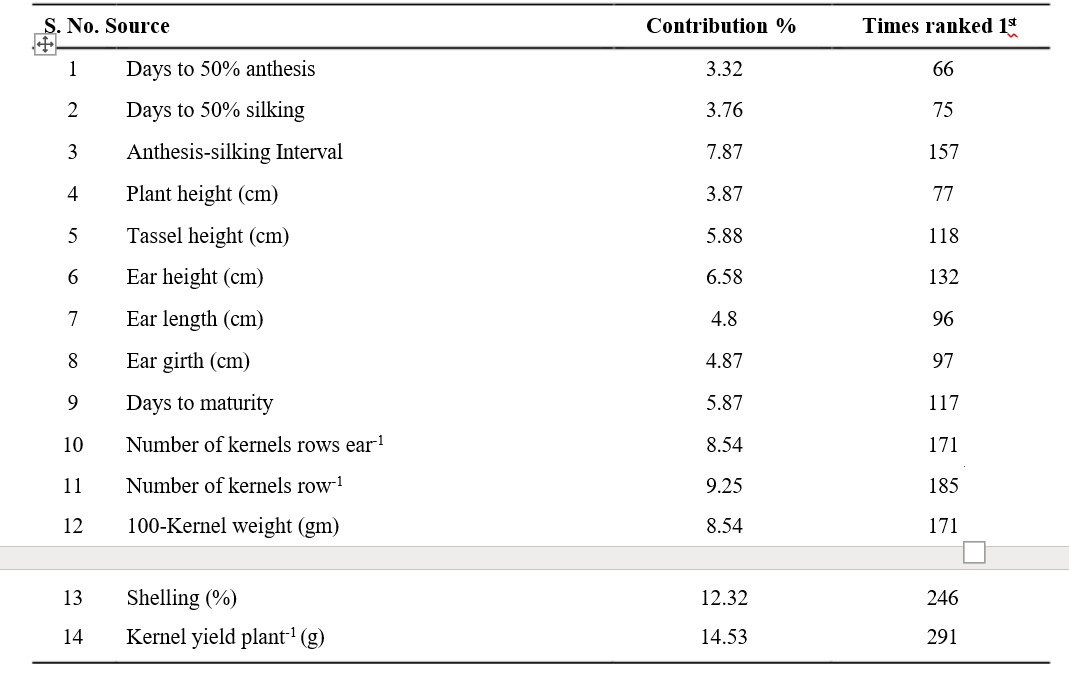
lines into five clusters is presented in Table 2. Cluster I yield plant-1 contributed the maximum (14.53%) to the had 15 inbred lines while, cluster II had highest number diversity by taking the first rank in 291 times, followed of inbred lines i.e., 37, cluster III had 10 inbred lines. by shelling percentage (12.32%) with 246 times ranked The clusters IV and V had single inbred line i.e., unitary first, number of kernels rows-1 (9.25%) with 185 times clusters. Jaishreepriyanka et al. (2020) reported similar ranked first and number of kernel rows ear-1 contributed grouping pattern of maize inbred lines in their studies.
The intra- and inter-cluster distances for the five clusters are summarized in Table 3 and visualised in Figure 2. Intra-cluster average D² values ranged from 0 to 99.05, with cluster II exhibiting the highest intra-cluster distance (99.05) and cluster I showing the lowest (51.91). Clusters IV and V had zero intra-cluster distances, as each contained a single inbred line, indicating their uniqueness and potential utility in breeding programs. Among inter-cluster distances, the lowest D² value was observed between clusters I and V (143.11), followed by clusters IV and III (175.83). The highest inter- cluster distance was recorded between clusters V and IV (2342.19), followed by clusters I and IV (2038.71).
The characters appeared in the first rank contribute more towards diversity. Among all the characters, kernel 8.54% with 170 times ranked first. 100-Kernel weight (8.54%) with 171 times ranked first. Other characters viz., anthesis- silking interval, ear height, tassel height, days to maturity, ear girth, ear length, plant height, days to 50% silking, days to 50% anthesis contributed 7.87, 6.58, 5.88, 5.87, 4.87, 4.8, 3.87, 3.76 and 3.32 per cent, respectively to the total genetic diversity (Table 5). Similar kind of results were reported by Amin et al. (2013), Maruthi et al. (2015) and Lone et al. (2017).
In this study, Mahalanobis D² statistics and the clustering pattern showed that Cluster II had the highest
ivnatrriaa-bcilluitsyteranddisptaontceentia(l99f.o0r5),witihnidni-ccaltuinstger ssigenleicfitcioannt. Clusters IV and V, containing only one inbred line each, were unique and may harbor rare alleles beneficial for breeding programs. The highest inter-cluster distance was recorded between Clusters IV and V (2342.19), followed by Clusters I and IV (2038.71), reflecting their extreme genetic divergence. Inbred lines from clusters with high inter-cluster distances are likely to produce
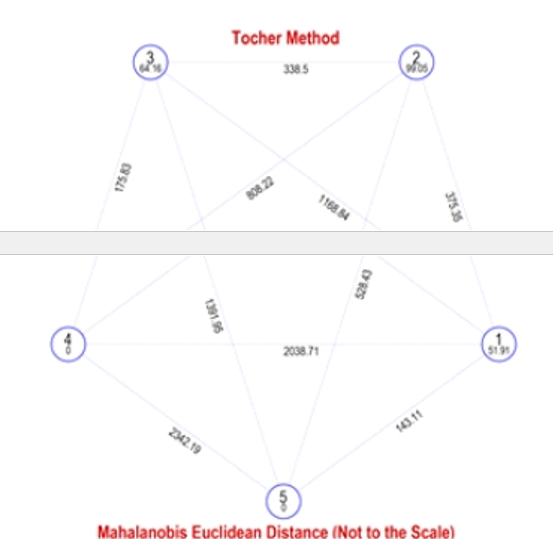
hybrids with maximum heterosis. Key traits contributing to genetic diversity included kernel yield plant⁻¹ (14.53%), shelling percentage (12.32%), and number of kernels row⁻¹ (9.25%), making lines excelling in these traits ideal for hybridization programs.
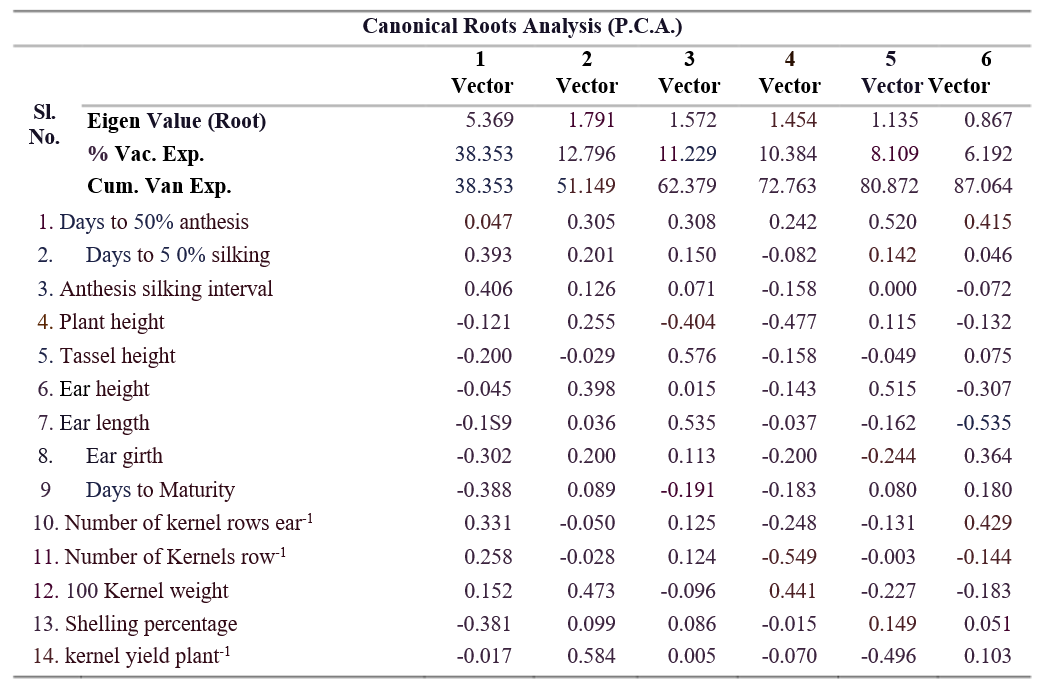
Principal component analysis (PCA) simplifies large datasets, like the one with 14 variables in this case, into a smaller set of variables called principal components (in this study, six components). PCA is a straightforward eigenvector-based multivariate analysis, typically performed on a symmetric covariance matrix.
The process involves eigenvalue decom position of covarience matrix or singular value decom position of the data matrix to extract the principal componeents.
The first principal component (PC1) explained
38.35 per cent of the variance, mainly driven by anthesis- silking interval, days to 50 per cent silking, and kernel traits. The second component (PC2) accounted for 12.80 per cent of the variance, with kernel yield plant⁻¹ and 100-kernel weight as key factors. PC3 (11.23%) was influenced by tassel height and ear length, while PC4 (10.38%) highlighted 100-kernel weight and days to 50 per cent anthesis. PC5 (8.11%) was shaped by days to 50% anthesis and ear height, and PC6 (6.19%) by the number of kernel rows-1 and days to 50% anthesis.
The PCA scores for 64 maize genotypes across the first three principal components were calculated and presented as three axes (X, Y, Z), with squared distances of each genotype from these axes. The scores were plotted in biplot. Figures 3. Genotypes positioned at the extreme
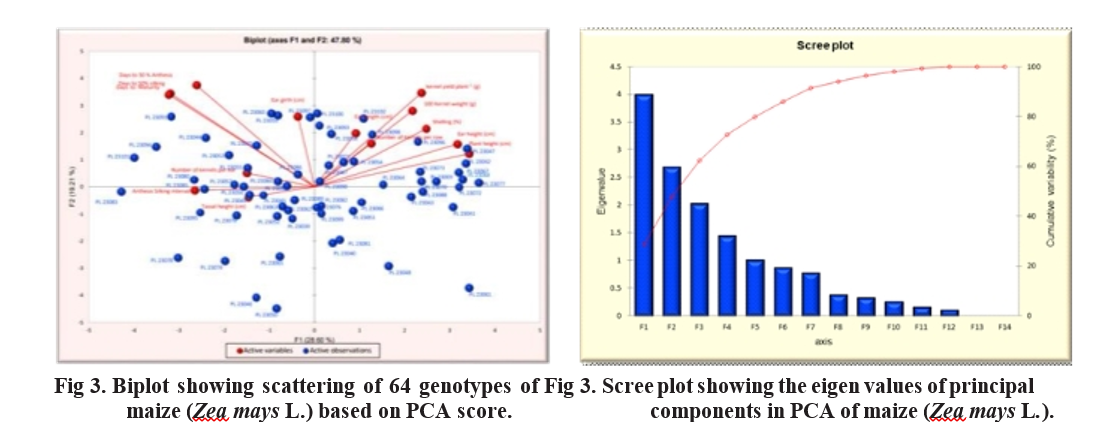
positive side on both axes, such as PL23101, PL23094 PL23083, PL23093, PL23049, and PL23060 along PCA I, and PL23093, PL23094, PL23102, PL23089, and PL23101 along PCA II, were identified as superior. In the biplot, genotypes like PL23091, PL23094, PL23101,PL23083 located far from the center which may be useful for hybridization programs.
The scree plot graph, constructed using eigen values and component numbers (Table 6), shows that from the 6th component onward, the line becomes nearly flat, indicating that each successive component contributes less to the total variance. In plant breeding, only those principal components with eigenvalues greater than 1 are typically retained, as they explain a significant amount of
variance. In this study, components like days to 50 per plant height and ear height as primary contributors to cent anthesis (4.004), days to 50 per cent silking (2.689), genetic diversity. Genotypes like PL23101 and PL23094 anthesis-silking interval (2.032), plant height (1.438), on extreme positive axes of PCA were superior, while and tassel height (1.002) have eigenvalues greater than combining clusters with high D² and PCA identified Components with eigenvalues less than 1, including traits that ensures generation of heterotic hybrids with traits such as ear height, ear length, ear girth, days to significant yield improvement. Selecting complementary maturity, and others, account for less variance and are traits, such as pairing high kernel yield with desirable considered less useful. The scree
The application of Mahalanobis D² statistics and Principal Component Analysis (PCA) in this study effectively identified significant genetic diversity among 64 maize inbred lines. Cluster analysis revealed substantial intra- and inter-cluster variation, with clusters IV and V showing unique potential for breeding due to their genetic divergence. The PCA reduced the complexity of 14 morphological traits into six principal components, explaining over 87% of the total variability, and identified key traits such as kernel yield plant-1,
Amin, M.N., Amiruzzaman, M., Ahmed, A., Rohman, M.M and Ali, M.R. 2013. The genetic diversity of white inbred lines of quality protein maize (QPM). Eco-Friendly Agricultural Journal. 6(9): 13-17.
Beck, D.L., Vasal, S.K and Crossa, J. 1990.Heterosis and combining ability of CIMMYT’s tropical early and intermediate maturity maize (Zea mays L.) germplasm. Maydica. 35 : 279-285.
DESAP. 2022. Annual report. Directorate of Economics Panse , nd Statistics Andhra Pradesh. https://des.ap.gov.in.
FAO.2023 .Database.FoodandAgricultureOrganization, Pearson, United Nations. www.fao.org/publications.
Jaishreepriyanka, R., Sinha, S., Mandal, S.S., Singh, 572. B and Rashmi, K. (2020). Diversity Analysis Rao, of Maize Inbred Lines. International Journal of Current Microbiology and Applied Sciences. 9(10), 2765-2773.
Lone, R.A. 2017. Genetic diversity in maize (Zea mays L.) inbred lines from Kashmir. International Journal of Pure Applicational Bioscience. 5 (1): 229-235.
Mahalanobis, P.C. 1936. On the generalized distance in statistics. Proceedding of National Institute of Science. 49-55.
Maruthi, R.T and Rani, K.J. 2015. Genetic variability, heritability, and genetic advance estimates in maize (Zea mays L.) inbred lines. Journal of Applied and Natural Science. 7 (1): 149-154.
Moll, R.H., Lonquist, J.H., Vele zFortuno, J. an dJohnson, E.C. 1965.The relationship of heterosis and genetic divergence in maize. Genetics. 52:139-144.
Naushad, A., Turi, S., Shah, S., Ali, S., Rahman, H., Ali, T and Sajjad, M. 2007. Genetic variability for yield parameters in maize (Zea mays L.) genotypes. Journal of Agricultural and Biological Science. 2(4-5): 1-3.
V.G .an dSukhatme ,P.V .1967 .Statistica lmethods for agricultural workers. ICAR Publications. v
of points in space. Philosophical Magazine. 2: 559–572.
R. 1952. Advanced statistical method in biometric research. John Wiley and Sons.
Singh, R.K. and Chaudhary, B.D. 1985. Biometrical methods in quantitative genetic analysis. Kalyani Publishers.
UN-COMTRADE. 2022. Database. The United Nations commodity trade statistics database. https:// comtradeplus.un.org/Publication/ITSY
Viola, G., Ganesh, M., Reddy, S.S and Kumar, C.V.S. (2003). Study on heritability and genetic advances in elite baby corn (Zea mays L.) lines. Progressive Agriculture. 3(2): 127-128.