
0 Views
B. HARI MALLIKARJUNA REDDY AND B. SAROJAMMA*
Department of Statistics, Sri Venkateswara University, Tirupati – 517 502.
In Time series and forecasting, there are wide range of models are there for fitting and prediction. They are regression models like Simple Regression models, Multiple Regression models, Polynomial Regression models, Logistic Regression models, Exponential models etc. Moving average models, Auto regression models, Vector Auto regression models (VAR), Generalised Autoregressive conditional Heteroscadesticity (GARCH), Auto Regressive Conditional Heteroscadesticity (ARCH) etc. In this paper, we are used Exponential Smoothing models like Simple Exponential Smoothing model, Holt linear trend model, Brow’s linear trend model and Damped trend models for Agriculture data like Rice, wheat, Nutri Cereals, Pulses, Oilseeds, Sugar cane, cotton and other Food grains of ten years data from 2008 to 2017. By using Root Mean Square Error criteria, We estimate best models for Agriculture data among four Exponential Smoothing models.
Agriculture data, exponential smoothing models, root mean square error criteria.
Agriculture plays major role in India. Agriculture employees more than 50 per cent of the Indian workforce and it contributes around 17-18 per cent to country GDP. In India, Agriculture is primary source for 50 per cent of population livelihood. Green Revolution in India was started on 1956 by M.S. Swaminathan for practice of traditional agriculture. Traditional farming included better irrigation systems, mixed cropping and planting of species. Green Revolution focused on two growth of high yielding varieties of plants and grains. This way highly practice spread by states of India like Punjab, Haryana, Western Uttar Pradesh, Tamil Nadu and Kerala. The state of Punjab led India’s green Revolution and earned the distinction of being country’s bread basket. Indian irrigation is mainly depending upon the canals and rivers and ground water well based system, tanks etc. Around two-third of Cultivation land in India is dependent on Monsoon and only 35 per cent of Agricultural Land in India was reliability irrigated.
The major and important agricultural production in India are Rice, Buffalo Milk, cow milk, Wheat, cotton, Mangoes, guavas, Fresh Vegetables, Chicken meat, potatoes, Bananas, Sugarcane, Maize, Oranges, Tomatoes, Chickpeas, Okra, Soyabeans, Hen Eggs, Cauli flower and Broccoli and onions. As per Agricultural Statistics, India grown is become the world’s largest producer of fresh
fruits, lemons and limes, Buffalo milk, whole fresh, castor oilseeds, Sunflower seeds sorghum, Millet, Spices, Jute, Beswar, nuts, papayas, chillies, peppers, Goat Milk, Coriander etc. As per old records, India is the second largest products of wheat, Rice, fresh vegetables, sugar cane, groundnuts with shells, lentils, garlic, cauliflowers and broccoli and green peas, sesame seeds, cashewnut with shells, Silkworm cocoons, cow milk, tea, potatoes, onions, cotton lint, cotton seeds, egg plants, nutmeg, cabbages, pumpkins, squash and gourds etc.
Ghosh et al. (2021) gave “conservational Tillage and weed management practices enhances farmers income and system productivity of Rice-wheat cropping system in central indices. They shifted farmer from conventional tillage practice to conservational tillage practice for crop cultivation of central indices by premix and trunk mix process to yield of rice-wheat cropping system. Khalili (2020) gave “Regression Analysis for yield comparison of saffron as affected by physiochemical properties of the soil case study in Northeast of Iran. They carried out research in two regions of Ghayen and Vamersan of Iran from 2015 to 2017. They taken samples of 30 saffron with three replications i.e. 90 saffrons samples from 3 to 5 years old farms. The parameters of the samples are texture, total nitrogen, available phosphorous and potassium PH, organic matter and electrical conductivity.
Performed regression analysis by yield as Dependent variable are remaining all are independent variables and method used is least squares method. Govindaraj et al. (2020) given “Genetic variables, Diversity and interrelationship for Twelve Grain Minerals in 122 commercial pearl millet cultivators in India”. They used Randomized Complete Block design with three replications at two locations of Patancheru and Mandor to aims of profile cultivate nutrition, diversity and interrelationship for grain minerals. Rai et al. (2016) gave article on Grain iron and zinc densities in release and commercial cultivators of pearl millet.
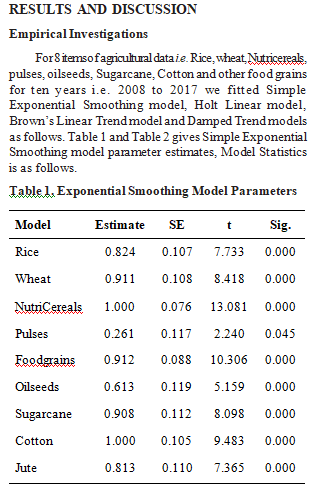
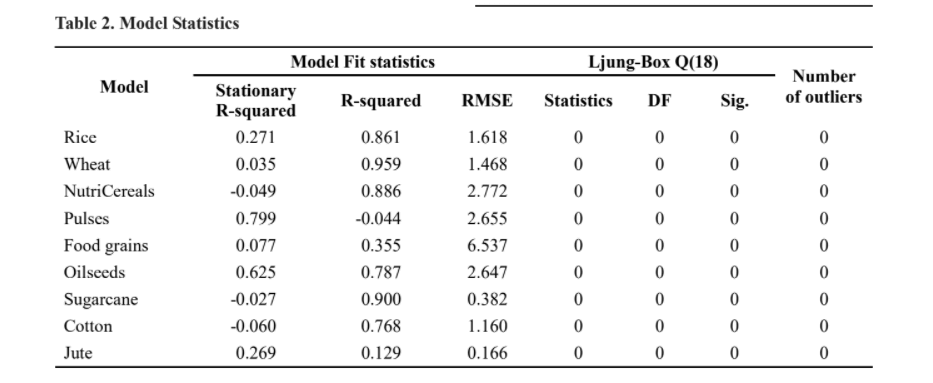
For Fitting and Forecasting of Agricultural data, we are using Simple Exponential smoothing, Holt Linear trend model, Brown’s linear trend model and Damped trend models for Rice, wheat, NutriCereals, Pulses, oilseeds, sugarcane, cotton and other food grains of ten year data i.e. from 2008 to 2017 of percentage share.
It was proposed by Brown, Holt and Winters in late 1950’s. It was the most successful forecasting methods. Forecasts produced using exponential smoothing methods are weighted averages of past observations with the weights decaying exponentially as the observations get
older. In similar manner as, the more recent observation higher than associated weight. There are many exponentially smoothing models but we are using.
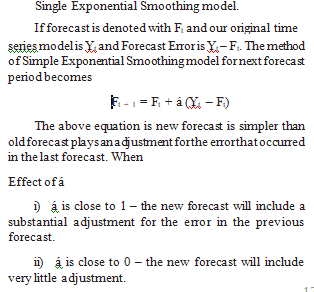
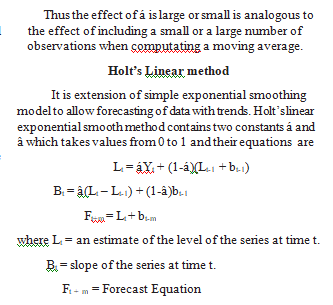
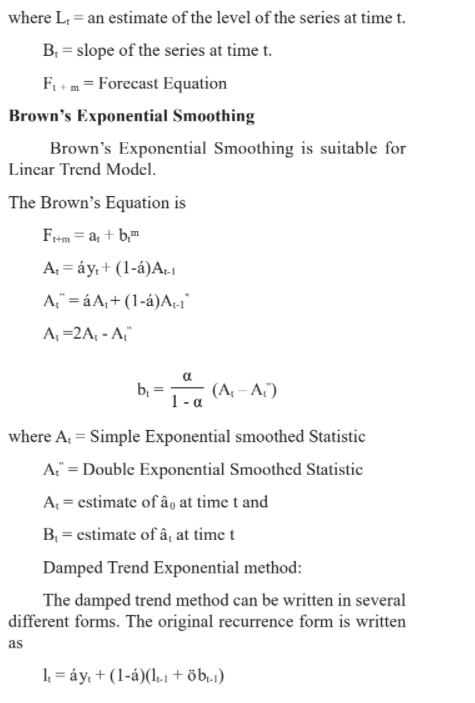
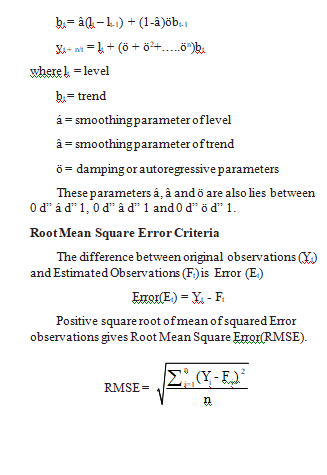
1) Simple Exponential Smoothing model (or)
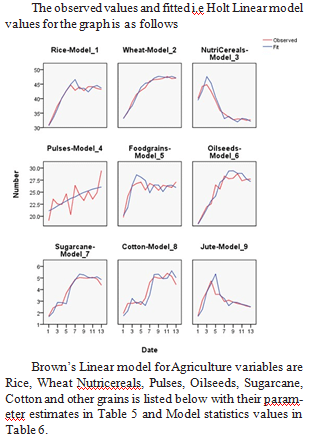
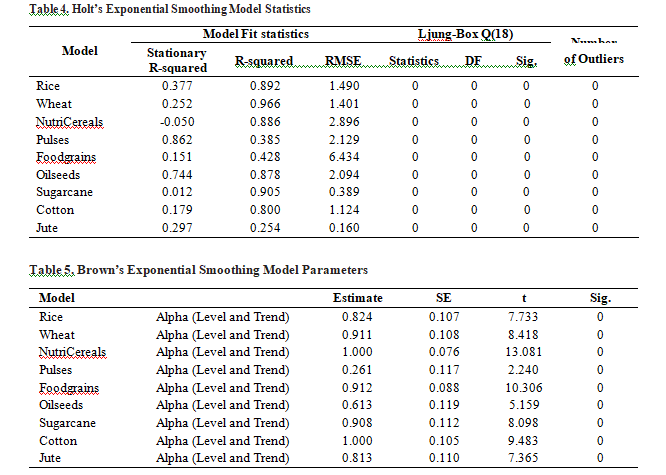
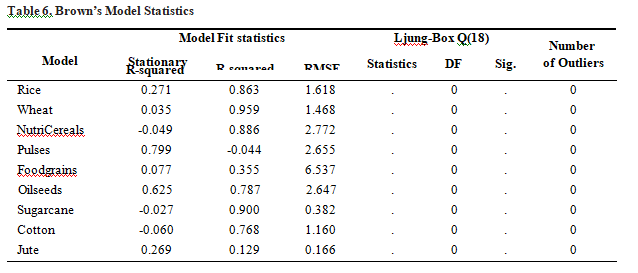
Brown’s Linear model for Agriculture variables are Rice, Wheat Nutricereals, Pulses, Oilseeds, Sugarcane, Cotton and other grains is listed below with their param- eter estimates in Table 5 and Model statistics values in Table 6.
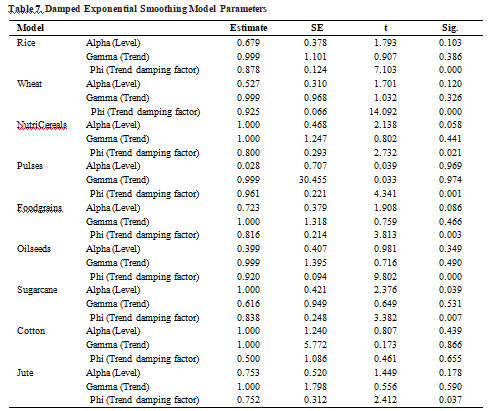
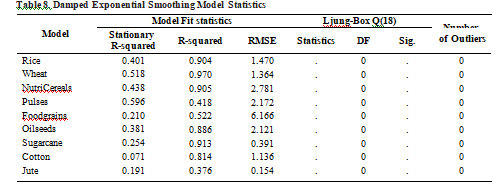
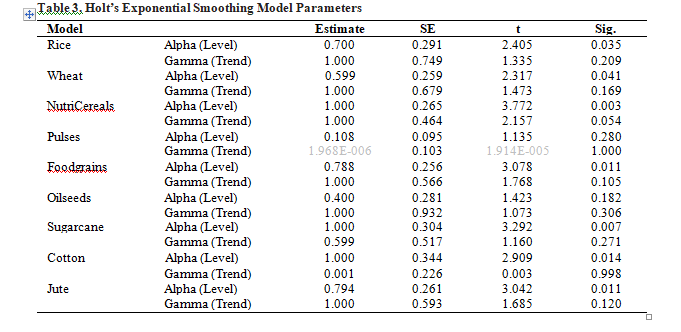
‘á’, ‘â’ and ‘ö’ i.e. level, Trend and Trend damping factor estimates of damped Exponential Smoothing model parameter estimates and its model statistics summary for Rice, Wheat, Nutricereals, Pulses, Oilseeds, Sugarcane, Cotton and other grains are as in Table 7 and Table 8 respectively.
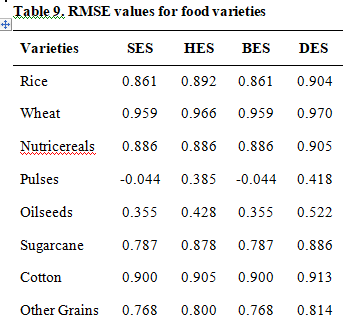
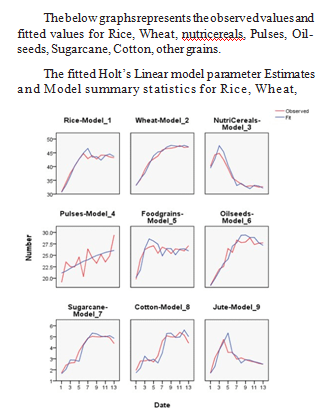
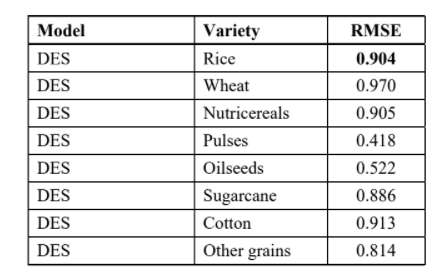
By observing Root Mean Square Error values, we conclude that Damped Exponential Smoothing(SES) model is the best for Rice, Wheat, Nutricereals and Oilseeds is the best fit for Holt’s Exponential model, For Sugar Cane and cotton for DES is the best and Damped Exponential model is the best for other grains.
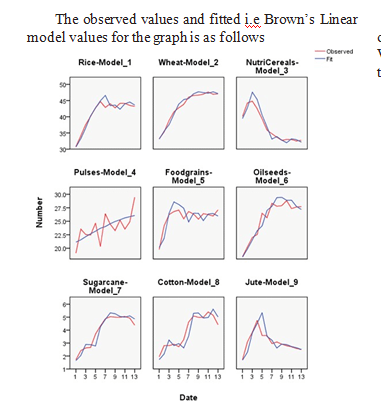
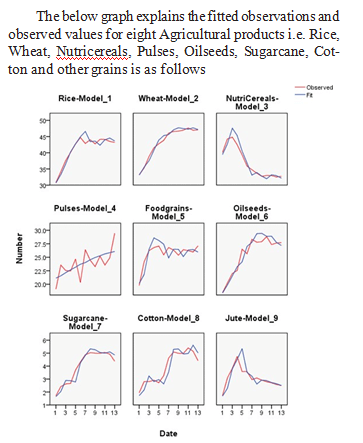
There are mainly some agricultural products such as Rice, Wheat, Nutricereals, Pulses, Oilseeds, Sugarcane, Cotton and other grains. We are fitted Simple Exponential Smoothing model, Holt’s Linear Exponential Smoothing models, Brown’s Exponential Smoothing model and damped Exponential Smoothing model. The fitted estimated values and Root Mean Square Error values for Best fitted is as follows.
LITERATURE CITED
Ghosh, D., Chethan, C.R., Kumar, S.C.B., Dubey, R.P., Bisen, H.S., Parey, S.K and Singh, P.K. 2021. Conservational Tillage and weed Management practices Enhance Farmeres income and system productivity of Rice-wheat Cropping System in central India. Evolutionary Ecology. 4: 1-9.
Khalili, M.R., Asadi, M.D., Torkashvand, A.M and Pazina, E. 2020. Regression analysis for yield comparison of saffron as affected by physic chemical properties of the soil, case study in north east of Iran. Agricultural Research. 9: 568-576.
Govindaraj, M., Yadav, O.P., Rajpurohit, B.S., Kanatt, H and Rai, K.N. 2020. Interrelationship for Twelve Grain Minerals in 122 commercial pearl Millet cultivators in India. Agricultural Research. 9(4): 516- 525.
Rai, K.N., Yadav, O.P., Govindraj, M., Pfeiffer, W.T.T., Yadav, M., Raj Purohit, B.S., Patil, H.T., Kanatti, A., Rathore, A., Rao, A.S and Shivade, H. 2016, Grain iron and cin densities in release and commercial cultivators of pearl millet, Indian Journal of Agricultural Science. 86: 291-296.