
0 Views
Department of Seed Science and Technology, S.V. Agricultural College, ANGRAU, Tirupati-517 502.
The present study was conducted during rabi, 2024-25 at the dryland Farm of S.V. Agricultural College, Tirupati, under Acharya N.G. Ranga Agricultural University, Andhra Pradesh. Twenty groundnut genotypes were evaluated to assess variability in morpho-physiological traits. The field experiment was laid out in Randomized Block Design (RBD) with three replications. Significant differences were observed among genotypes for all studied traits. Among the twenty genotypes, TAG-24 was the earliest maturing genotype, while Dheeraj exhibited the greatest plant height. TCGS-1694 and Kadiri-9 showed the highest leaf area index and SCMR, respectively. The findings indicate considerable genetic variability, offering scope for selection and improvement in groundnut breeding programs.
KEYWORDS: Morpho-physiological traits, Genetic variability, Randomized Block Design.
Groundnut (Arachis hypogaea L.) is an important oilseed crop, belonging to the family Leguminosae. This self-pollinating plant species possesses a specific chromosome count of 2n = 40. Its introduction to India occurred in the first half of the sixteenth century. China is the world’s leading producer of groundnut, followed by India, the United States and Argentina. Globally, India is the largest exporter of groundnut, which is grown in an area of 4.7 million hectares with a production and productivity of 10.1 million tonnes and 2163 kg ha-1, respectively. In Andhra Pradesh, groundnut is grown in an area of 3.11 lakh hectares with a production and productivity of 3.23 lakh tonnes and 1011 kg ha-1, respectively (www.indiastat. com, 2023-24). Any morphological trait that significantly contributes to yielding ability or is linked to better pod yield would be helpful in increasing yield. To overcome the yield constraints within the genotypes, morpho- physiological trait-based investigations are required (Dharanguttikar and Borkar, 2014). In many groundnut genotypes, there is insufficient knowledge regarding morpho-physiological characteristics. For achieving genotype with desirable traits, it is essential to look at the inter-relationships between different characters.
The experiment was carried out using twenty groundnut genotypes at dryland farm of S.V. Agricultural
College, Tirupati, Andhra Pradesh during rabi, 2024-25. The field trial was laid out in Randomized Block Design (RBD) with twenty genotypes and replicated thrice, with a spacing of 22.5 cm between the rows and 10 cm between the plants within a row, with row length of 5 m and four rows. The morpho-physiological traits studied in the field were days to 50 % flowering, number of branches per plant, initial and final plant population per plot, plant height, total dry matter production per plant, days to maturity, leaf area index and SCMR. The various plant components were picked and dried in a hot air oven at 80 °C until they reached a consistent weight in order to determine the Total dry matter production (TDMP). The leaf area index was calculated by dividing the total leaf area by the corresponding ground area. SPAD chlorophyll meter reading (SCMR) was measured on five randomly selected plants from each genotype in each replication at 60 DAS using Minolta SPAD-502 chlorophyll meter and the measurements were taken on the third leaf from the terminal bud of main axis. The data recorded were analysed statistically using OPSTAT software by adopting Randomized Block Design (RBD) with three replications for field experiment as described by Panse and Sukhatme (1985). The standard error of difference was calculated at 5 and 1 per cent probability levels to compare the mean difference among the treatments.
The morpho-physiological data obtained from
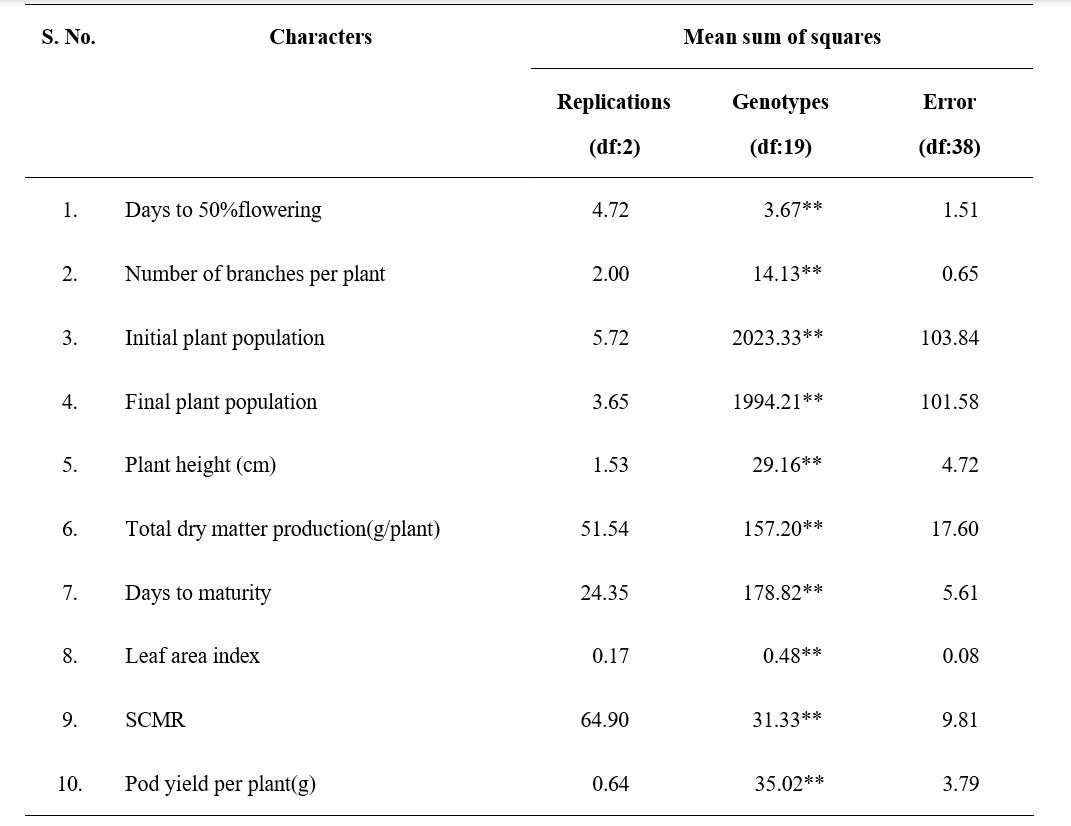
the ANOVA is presented in Table 1. The result showed significant differences among all the morpho- physiological traits of twenty groundnut genotypes. However, Singh et al. (2003) found a significant variation in leaf area index and SPAD chlorophyll meter reading of eight different Virginia type peanuts.
Number of days to 50 per cent flowering of different genotypes ranged from 23.67 to 28.67 days. Significant differences were found among the genotypes and highest was recorded by Kadiri-1812 (28.67). Second highest days to 50 per cent flowering was recorded by Kadiri-9 (28.00) which was on par with TCGS-2370 (28.00). Lowest days to 50 per cent flowering was recorded by TAG-24 (23.67) followed by TCGS-2361 and Dharani (25.67). The results are in line with Maurya et al. (2014) in which analysis of variance revealed the prevalence of significant difference among the genotypes for days to 50 per cent flowering.
Number of branches per plant for different genotypes ranged from 5.52 to 12.81. Significant differences were found among the genotypes and highest number of branches per plant was recorded by Kadiri-8 (12.81). Second highest number of branches per plant was recorded by Kadiri-7 (12.47). Lowest number of branches per plant was recorded in TAG-24 (5.52) which was on par with TCGS-2490 (5.52) followed by Kadiri-6 (5.65). The results in the present study are also in agreement with Bharathi (2010) that the number of

branches differed significantly among the seed sizes and varieties.
Initial plant population for different genotypes ranged from 56.33 to 152.00. Significant differences were found among the genotypes and highest initial plant population was recorded by TCGS-2055 (152) followed by TAG-24 (141) and lowest initial plant population was observed in TCGS-2301 (56.33) followed by TCGS- 2370 (65.67). Final plant population of twenty genotypes was ranged from 54.67 to 150.00 Significant differences were found among the genotypes and highest final plant population was recorded by TCGS-2055 (150). Second highest final plant population was found in TAG-24 (139). Lowest final plant population was recorded in TCGS-2301 (54.67) followed by TCGS-2370 (64.33).
Plant height for different genotypes ranged from 22.48 to 35.43 cm. Significant differences were found among the genotypes and highest plant height was recorded by Dheeraj (35.43 cm) and second highest plant height was recorded by Kadiri-7 (33.97 cm). Lowest plant height was recorded by TCGS-2359 (22.48 cm) followed by TCGS-1694 (26.29 cm). Maurya et al. (2006) showed the similar findings that analysis of variance revealed the prevalence of significant difference among the genotypes for plant height. Bharathi (2010) reported that the plant height increased with increase in age of the crop and attained maximum plant height at harvest in all the seed sizes.
Total dry matter production for different genotypes ranged from 27.69 to 53.97 g. Significant differences were found among the genotypes and highest total dry matter production was recorded by TCGS-2301 (53.97 g) followed by Kadiri-8 (53.03 g). Lowest total dry matter production was recorded by Kadiri-6 (27.69 g) followed by TCGS-2490 (31.81 g).
Days to maturity found significant differences among the genotypes and highest was recorded by Kadiri-1812 (130.67) followed by Kadiri-8(125.33) and lowest was TAG-24 (96.33) followed by Central Pragathi (105.33). Similar findings of Maurya et al. (2014) reported that analysis of variance revealed the prevalence of significant differences among the genotypes for days to maturity.
Leaf area index for different genotypes ranged from 1.60 to 2.84. Significant differences were found among the genotypes and highest was recorded by TCGS-1694 (2.84) followed by Dharani (2.73). Lowest leaf area index was found in Nithya Haritha (1.60) followed by TAG-24 (1.61).
SCMR for different genotypes ranged from 42.97 to 54.10. Significant differences were found among the genotypes and highest was recorded by Kadiri-9 (54.10). Second highest SCMR was recorded by Kadiri-8 (52.63) and lowest by TCGS-2369 (42.97) followed by TCGS- 2368 (43.53).
The data of different genotypes for pod yield per plant with mean of 18.49 (g). Pod yield per plant for different genotypes ranged from 12.86 g to 28.13 g. Significant differences were found among the genotypes and highest pod yield per plant was recorded by Kadiri-7 (28.13 g). Second highest pod yield per plant was recorded by TCGS-2369 (25.87 g). Lowest pod yield per plant was observed in Dharani (12.86 g) followed by Central Pragathi (14.94 g).
The pod yield of genotypes was mainly due to favourable yield contributing characters like number of pods per plant, number of kernels and harvest index. These findings were on the similar lines to those reported by Borate et al. (1993)
Among all the genotypes, TAG-24 was the earliest genotype with respect to 50% flowering and maturity. Dheeraj is tall and TCGS-2359 is short in stature. Number of branches per plant were highest in Kadiri-8 and least in TCGS-2490. Leaf area index was highest in TCGS-1694 and least was observed in Nithya Haritha. SCMR was highest in Kadiri-9 and least was observed in TCGS-2369. Total dry matter production was highest in TCGS-2301and least was observed in Kadiri-6. Highest pod yield per plant was recorded by Kadiri-7.
Bharathi, M. 2010. Effect of seed size on seedling vigour and crop productivity in groundnut. Ph.D. Thesis. Acharya N G Ranga Agricultural University, Rajendranagar, Hyderabad.
Borkar V.H and V.M. Dharanguttikar. 2014. Evaluation of groundnut (Arachis hypogaea L.) genotypes for physiological traits. International Journal of Scientific and Research. 4(1): 1-8.
Choudhary, R.R., Avtar, R., Kajla, S.L., Ram, M., Dhaka, B and Poonia, M.K. 2024. Genetic variability and association studies for morpho-physiological traits under timely and late sown conditions in Indian mustard (Brassica juncea L). Journal of Oilseed Brassica. 15(2): 163-171.
Dharanguttikar V.M and V.H. Borkar. 2014. Physiological analysis of groundnut (Arachis hypogaea L.) genotypes. International Journal of Scientific and Research publications. 4(1): 1-9.
Maurya, C.l., Khan, A.A., Singh, P and Yadav, V. K.S. 2006. Studies of various vigour test and their correlation with field emergence in oat (Avena sativa L.). Farm Science Journal. 15(1): 73-74.
Maurya, M.K., Rai, P.K., Kumar, A., Singh, B.A and Chaurasia, A.K. 2014. Study on genetic variability and seed quality of groundnut (Arachis hypogaea L.) Genotypes. International Journal of Emerging Technology and Advanced Engineering. 4(6): 818- 823.
Nabati, J., Mirmiran, S.M., Yousefi, A., Zare Mehrjerdi, M., Ahmadi‐Lahijani, M.J and Nezami, A. 2023.
Identification of diverse agronomic traits in chickpea (Cicer arietinum L.) germplasm lines to use in crop improvement. Legume Science. 5(2): 167.
Panse, V. G. and Sukhatme, P. V. 1985. Statistical Methods for Agricultural Workers. ICAR, Publications, New Delhi (India).
Reddy, P., Sabara, P., Padhiyar, S., Kulkarni, G., Sapara, G.K and Tomar, R.S. 2023. Correlation and path analysis in groundnut (Arachis hypogaea L.) genotypes through agro-morphological study: Correlation and path analysis in groundnut. Annals of Arid Zone. 62(3): 227-234.
Singh, A. K., Dwivedi, S. L., Pande, S., Moss, J. P., Nigam, S. N and Sastry, D. C. 2003. Registration of rust and late leaf spot resistance peanut germplasm lines. Crop Sciences. 43: 440-441.