
0 Views
Department of Genetics and Plant Breeding, S.V. Agricultural College, ANGRAU, Tirupati-517 502
An experiment was conducted to evaluate performance of 36 groundnut genotypes for yield and yield attributes at Regional Agricultural Research Station, Tirupati, during rabi 2021-22 laid out in Alpha Lattice Design with two replications. Analysis of variance indicated significant differences among the genotypes for all the traits indicating the existence of ample amount of variability in the material for all the traits under consideration. TCGS 2233, TCGS 2223, TCGS 2347, UBEK 21-67, UBEK 21- 70, UBEK 21-68, Rohini and UBEK 21-76 were found as promising genotypes and could be exploited for improvement of yield and yield attributes in the breeding programme as donors.
KEYWORDS: Groundnut, mean performance, evaluation, yield.
Groundnut, a self-pollinated legume crop is one of the most important cash crop cultivated for edible oil, food and feed. Globally, it is cultivated in an area of 31.5 million hectares with production and productivity of 53.6 million tonnes and 1699 kg ha-1, respectively (FAOSTAT, 2020). India ranks second among the groundnut producing countries in the world with an area of 6.09 million hectares, production of 10.21 million tonnes and productivity of 1676 kg ha-1. In Andhra Pradesh, it is cultivated in an area of 0.87 million hectares with a production of 0.78 million tonnes and an average productivity of 894 kg ha-1 (Directorate of Economics and Statistics, Govt. of A.P, India, 2020- 2021). With the ever-growing population, the constant need to increase productivity by developing elite high yielding genotypes is inevitable. Genetic improvement of yield is a primary concern for a plant breeder and yield being a complex and quantitative trait, it is important to evaluate components associated with yield. Thus, the present investigation mainly focused on identifying the genotypes with superior performance for yield and yield attributes.
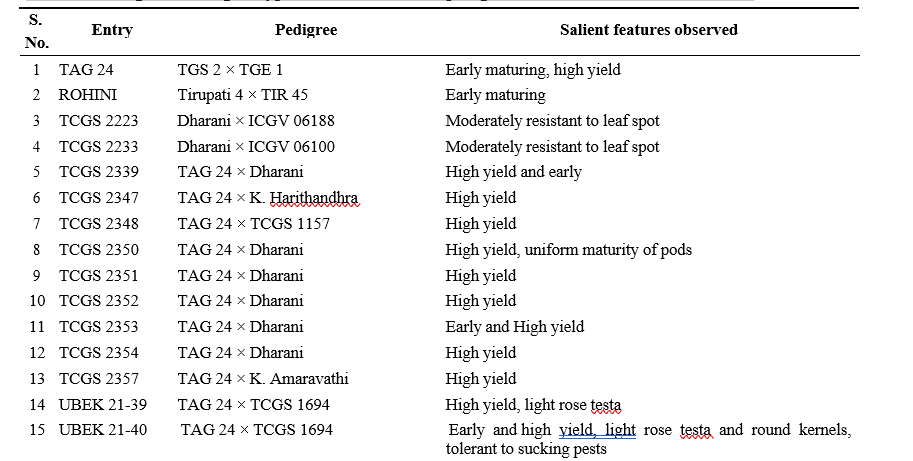
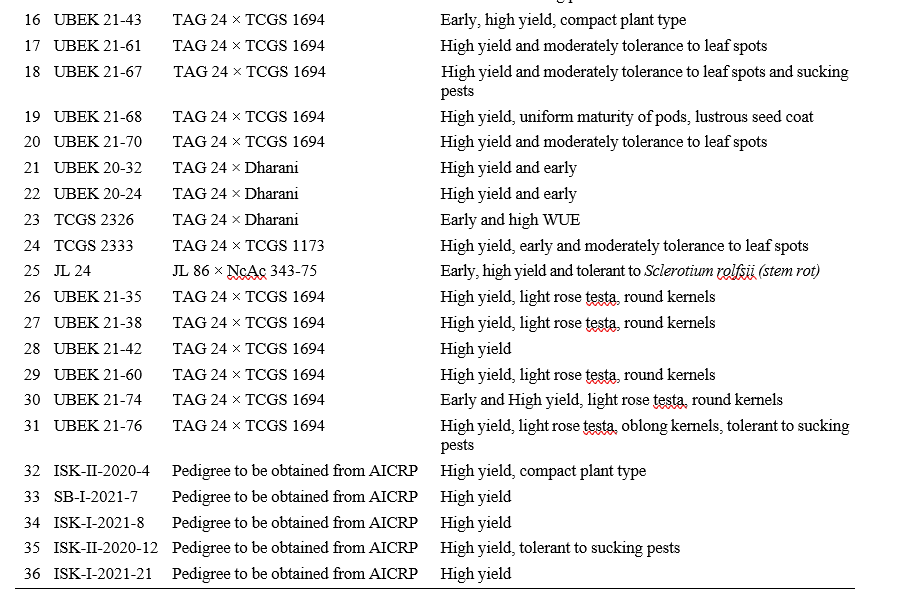
The field experiment was carried out with 36 advanced breeding lines of groundnut at Regional Agricultural Research Station, Tirupati during rabi 2021-22 in alpha lattice design with two replications. 36 genotypes were sown in each replication by randomization in four blocks each with nine genotypes. Recommended NPK (20 N + 40 P2O5 + 50 K2O kg ha-1 & 500 gypsum kg ha-1) fertilizers were applied as basal dose. Standard crop management and plant protection practices were followed during the crop stand. List of genotypes under study were presented in Table 1 along with pedigree and salient features observed. The observations were recorded on randomly selected five plants in each genotype in each replication for plant height, number of primary branches per plant, number of secondary branches per plant, number of mature pods per plant, number of immature pods per plant, harvest index, shelling percentage, pod yield per plant, kernel yield per plant, hundred pod weight, hundred kernel weight, number of sound mature kernel and sound mature kernel weight. Days to maturity was recorded on plot basis. Analysis of variance was carried out as suggested by Patterson and Williams (1976) using R packages (version 3.1.1).
Analysis of variance indicated significant differences among the genotypes for all the traits indicating the existence of ample amount of variability in the material for all the traits under consideration. The per se performance for yield and yield components were furnished in Table 2. List of promising genotypes for each yield trait was presented in Table 3.
To sum up the most relevant findings of the present study, genotypes viz., TCGS 2347, TCGS 2233, UBEK 21-67, UBEK 21-70, UBEK 21-68 exhibited better performance for pod yield plant-1. Among these lines, TCGS 2347 and UBEK 21-67 showed higher kernel yield plant-1 as well. In addition to these traits, TCGS 2347 exhibited superior performance for number of
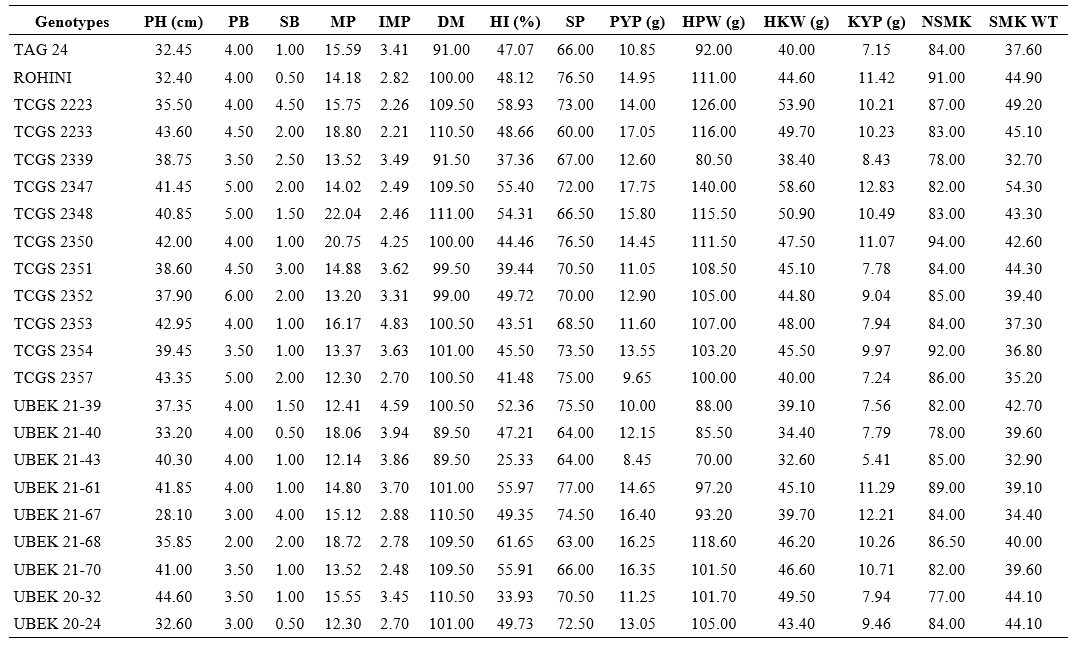
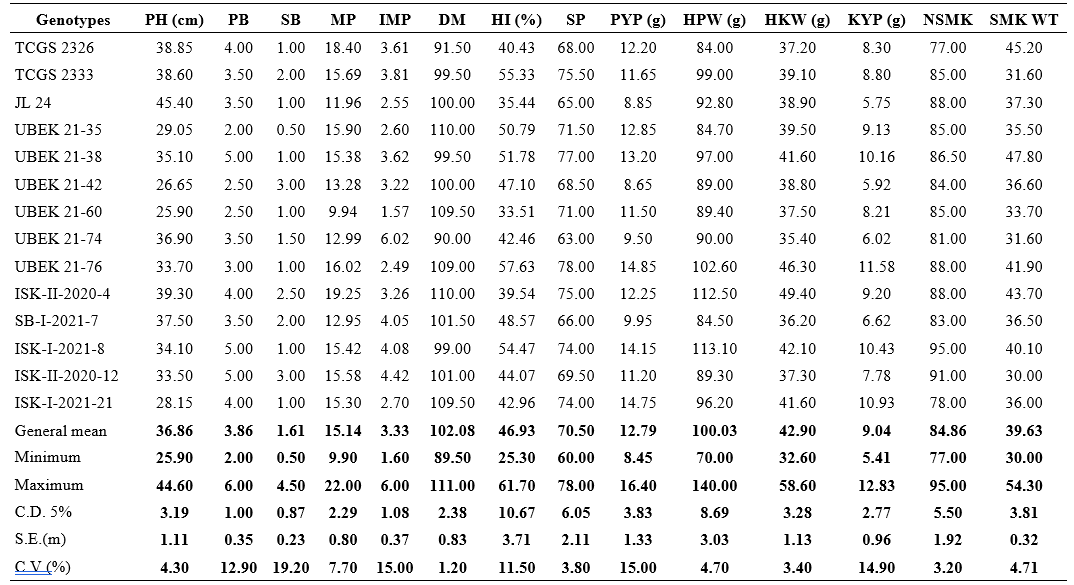
PH: Plant height, PB: Number of primary branches plant-1, SB: Number of secondary branches plant-1, MP: Number of mature pods plant-1, IMP: Number of immature pods plant-1, DM: Days to maturity, HI: Harvest index, SP: Shelling percentage, PYP: Pod yield plant-1 (g), HPW: Hundred pod weight, HKW: Hundred kernel weight, KYP: Kernel yield plant-1 (g), NSMK: Number of sound mature kernels, SMK WT: Sound mature kernel weight.
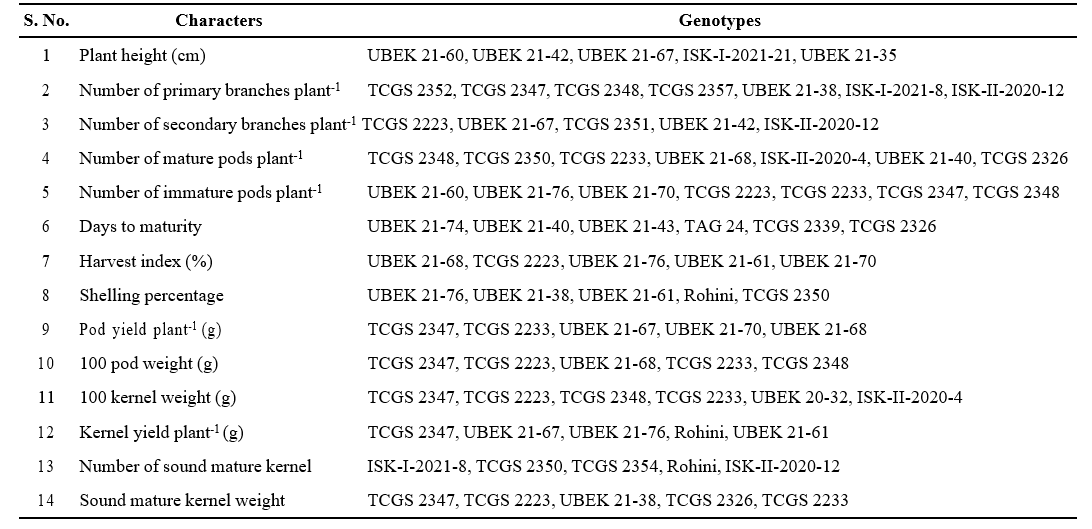
primary branches plant-1, 100 pod weight, sound mature kernel weight and 100 kernel weight. TCGS 2233 was also observed to be promising for number of mature pods plant-1, 100 pod weight, 100 kernel weight whereas, UBEK 21-68 recorded higher harvest index, number of mature pods plant-1, 100 pod weight and UBEK 21-70 recorded higher harvest index. UBEK 21-76, Rohini and UBEK 21-61 recorded higher kernel yield plant-1. UBEK 21-61 performed better for shelling percentage and harvest index whereas, Rohini recorded higher mean performance for shelling percentage, number of sound mature kernel. genotypes viz., UBEK 21-74, UBEK 21-40, UBEK 21-43, TAG 24, TCGS 2339 and TCGS
2326 recorded early maturity at 90 DAS. Among these genotypes, UBEK 21-40 and TCGS 2326 recorded more number of mature pods plant-1. From the current investigation, the genotypes viz., TCGS 2233, TCGS 2223, TCGS 2347, UBEK 21-67, UBEK 21-70, UBEK 21-68, Rohini and UBEK 21- 76 were found as promising genotypes and could be exploited for improvement of yield and yield attributes in the breeding programme as donors. UBEK 21-74, UBEK 21-40, UBEK 21-43, TAG 24, TCGS 2339 and TCGS 2326 were identified as early maturing genotypes. Their duration is to be confirmed in all the seasons in multilocations. Meanwhile, Rohini and UBEK 21-76 which are medium maturing genotypes could be utilized for improving yield and its contributing characters, along with maturity at the same time.
Directorate of Economics and Statistics, Department of Agriculture, cooperation and Farmers Welfare, GOI. 2020-2021. Agricultural Statistics at a glance. 50-51.
FAOSTAT, 2020. Food and Agriculture Organization of the United Nations. World Agricultural Production, Rome, Italy. http://faostat.fao.org/.
Patterson, H.D and Williams, E. 1976. A new class of resolvable incomplete block designs. Biometrika. 63(1): 83-92.