
0 Views
M. CHARWAKA*, Y. PRABHAVATHI, N. VANI AND G. MOHAN NAIDU
Institute of Agribusiness Management, S.V. Agricultural College, Tirupati, A.P., 517 502.
Tobacco is one of the commercial crops grown in India and and in many other countries. Nicotiana tabacum and Nicotiana rustica are the commercially cultivating species of tobacco. Tobacco is contributing a significant income to the nation economy in the form of excise revenue and foreign exchange. Though India is the third largest producer and second largest exporter of tobacco, its share in global tobacco trade is only six per cent by value. The main objective of the study is to analyse the structural changes in tobacco exports from 2009-10 to 2017-18 by using markov chain analysis. The major findings of the study revealed that South and South East Asia was the stable export destination for Indian unmanufactured tobacco followed by West Europe and Middle East. Africa was found to be unstable market for Indian unmanufactured tobacco during the study period.
Transition probability matrix, exports, imports, stable and unstable markets.
Tobacco (Nicotiana Species) belongs to the genus Nicotiana and family Solanaceae is one of the important commercial crops grown all over the world with leaf as an economical part. Mexico was the origin place of tobacco and the crop is grown mostly in tropical and subtropical climatic regions. Out of roughly 70 known species in Nicotiana genus, only Nicotiana tabacum and Nicotiana rustica are commercially cultivating species. The tobacco is categorized into two types viz., Flue Cured Virginia tobacco (FCV) and non-Flue Cured Virginia tobacco (non-FCV) based on the curing procedure of the leaf. FCV tobacco is having significant commercial importance (Mandanna et al., 1998).
Indian tobacco exports comprised of both unmanufactured and manufactured forms. Unmanufactured form dominates the Indian tobacco export market with 85 per cent share, out of which FCV tobacco alone constitutes for around 70 per cent share and valued nearly around Rs. 3000 crores. Indian tobacco export accounted for 6 per cent by value in global leaf export trade of US$ 12 billion (TII, 2019). Indian tobacco export destinations were categorized into seven regions viz., West Europe, East Europe, Middle East, North and South America, South East Asia, Africa and Australia.
Indian tobacco experts have been showing a slow but increasing trend over the past decade. To improve the export performance of Indian unmanufactured tobacco, change in the structural changes need to be studied to focus on the new markets and to retain the current share of exports to different countries.
Markov chain analysis is engaged to analyse the structural changes in a system whose progress can be measured in a single outcome variable (Dent, 1967). This is the method of predicting the behaviour of a variable by analysing the past behaviour of that variable. The estimation of transitional probability index is central to the Markov chain analysis. The elements Pij of the matrix P will indicate the switching of exports from country i to country j by the wearing of time. The row elements will indicate the retention probabilities and loss of trade, while the column elements will indicate the retention probabilities and the gain of the trade with the during the study period (Kusuma and Basavaraja, 2014). The diagonal elements of the matrix P will indicate the retention probabilities of respective regions. Therefore, examination of the diagonal elements will show the loyalty of an importing country towards a commodity.
In this study the average Indian tobacco exports to a particular region was considered to be a random variable which depends only on its past exports to that region, which can be algebraically denoted as
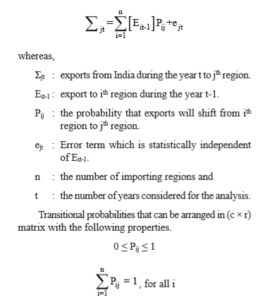
Thus, the expected export shares of each region during the period ‘t’ were obtained by multiplying the exports to those regions in the previous period (t-1) with the transitional probability matrix.
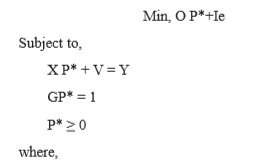
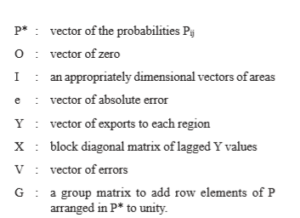
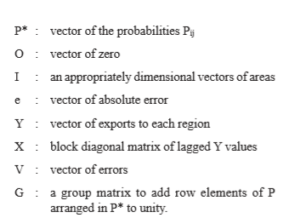
The conventional linear programming techniques were used as this satisfies the properties of transitional probabilities of non-negativity restriction and sum constraints in estimation (Tejaswi et al., 2006). The linear programming formulation is stated as
Transitional probability matrix reveals the structural changes in Indian unmanufactured tobacco trade among the different regions over the study period i.e., from 200910 to 2017-18. From the Table 1, South and South East Asia was the most stable importer of Indian unmanufactured tobacco during the study period by retaining most of its previous share i.e. around 46.81 per cent. South and South East Asia had lost around 52.79 per cent of its share to West Europe. It had gained a share of around 75.71 per cent and around 88.17 per cent from North and South America and Australia respectively. West Europe was also a loyal market for Indian unmanufactured tobacco as the region retained around 42.34 per cent of its previous share. This region had lost a share of around 29.69 per cent to Africa, 10.56 per cent to East Europe majorly. The region had gained a share of around 52.79 per cent and 55.30 per cent from South and South East Asia and Africa respectively.
West Europe was followed by Middle East by retaining 36.08 per cent of its previous share. Middle East had lost 33.76 per cent and 30.15 per cent of its share to East Europe and Africa respectively. It has gained a share of 52.97 per cent from East Europe.
East Europe was a moderately loyal market for Indian unmanufactured tobacco as the region retained around 33.75 per cent of its previous share. East Europe had lost most its share i.e. around 52.97 per cent to Middle East and gained from Middle East and Africa to an extent of around 33.76 per cent and around 19.74 per cent respectively.
North and South America and Australia were less loyal markets as they retained only around 24.28 per cent
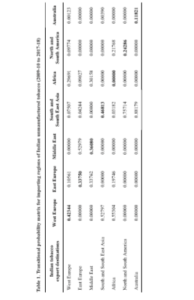
and 11.82 per cent respectively. North and South America had lost around 75.71 per cent of it share to South and South East Asia and gained around 21.76 per cent from Africa. Australia had lost around 88.17 per cent to South and South East Asia.
Africa can be considered as dis-loyal market for Indian unmanufactured tobacco during the study period i.e. from 2009-10 to 2017-18 as the region had not retained any of its previous share. The Africa’s share had lost majorly to West Europe (55.30%) followed by South America (21.76%) and East Europe (19.74%). The region had gained a share of around 29.69 per cent from West Europe and 30.15 per cent from Middle East.
South and South East Asia was the most loyal export region for Indian unmanufactured tobacco as the region had retained around 46.81 per cent of their previous share imports during the study period i.e., from 2009-10 to 2017-18. South and South East Asia was followed by West Europe by retaining 42.34 per cent of its original import share.
Middle East, East Europe, North and South America and Australia were found to be stable importers after South and South East Asia and West Europe with retention of around 36.08 per cent, 33.75 per cent, 24.28 per cent and 11.82 per cent respectively. The Africa region was found to be unstable importer of Indian unmanufactured tobacco as they could not retain any of their previous import share.
Dent, W.T. 1967. Application of Markov Analysis to International Wool Flows. Review of Economics and Sciences. 49(2): 613-616.
Fact Sheets Report. 2019. The Tobacco Institute of India.
Kusuma, D.K and Basavaraja, H. 2014. Stability analysis of mango markets of India: Markov chain approach. Karnataka Journal of Agricultural Sciences. 27(1): 36-39.
Mandanna, P.K., Urs, D.S.D and Achoth, L. 1998. Structural changes in India’s tobacco exports: A Markov chain approach. Tropical Agricultural Research. 10: 134-142.
Tejaswi, P.B., Naik, B.K., Kunnal, L.B and Basavaraj, H. 2006. Direction of trade and changing pattern of Indian coffee exports- An application of Markov chain analysis. Karnataka Journal of Agricultural Sciences. 19(1): 71-75.