
0 Views
V. RAGAMALIKA*, S. RAJESWARI, B. APARNA AND B. RAVINDRA REDDY
Department of Agricultural Economics, S.V. Agricultural College, Tirupati, A.P. 517502
The present study was aimed to know the direction of cropping pattern changes in the selected districts of Rayalaseema region of Andhra Pradesh by using Markov chain analysis. Time series data on area under different crops grown in the selected districts for a period from 1992-93 to 2016-17 was collected and analysed. The results revealed that other crops had highest retention probability (0.9520) in Chittoor district, in Y.S.R Kadapa district cotton had highest retention probability to an extent of 0.8050, in Anantapuramu district groundnut had highest retention probability of 0.8737 and Sunflower had highest retention probability (0.8635) in Kurnool district
Crop shifts, markov chain analysis, transitional probability matrix.
Agriculture is continued to play an important role for poverty alleviation in India, even in the era of economic liberalization and globalization. More than 70 percent of India’s population lives in rural areas where the occupation is agriculture. Indian agriculture is characterized by small farm holdings. The average farm size is only 1.57 hectors. Around 93 per cent of farmers have land holdings smaller than 4 ha and they have cultivated nearly 55 percent of the areable land. Crop diversification is intended to give a wider choice in the production of a variety of crops in a given area so as to expand production related activities on various crops and also to lesson risk.
Crop diversification in India and also in Andhra Pradesh is generally viewed as a shift from traditionally grown, less remunerative crops to more remunerative crops. The crop shift also takes place due to government policies and thrust on some crops over a given time, for example creation of the technology mission on oilseeds (TMO) to give thrust on oilseeds production as a national need for the country’s requirement for less dependency on imports. Market infrastructure development and certain other price related supports also induce crop shift often low value to high value commercial crops. Crop diversification was generally practiced in rain fed lands to reduce the risk factor of crop failures due to drought or less rains. Crop substitution and shift are also taking place in the areas with soil problems.
Andhra Pradesh State is identified as the “bejewelled rice bowl of India”. Agriculture plays a crucial role in the economy of Andhra Pradesh. Large segment of the population is dependent on the agriculture sector for employment and income. About 70 per cent of the population of Andhra Pradesh lives in rural areas and depends for its livelihood on agriculture and the rural non-farm sector.
Andhra Pradesh over the decades has witnessed gradual transformation of the agricultural sector. The nature of the transformation itself has undergone change overtime. During 1980s, there was a shift in agriculture from traditional cereal based system towards commercial crops like oil seeds, cotton and sugarcane. By 1990s, even though the crop sector witnessed high volatility due to consecutive droughts and decelerating crop yields, the transformation continued towards high value crops. High value crops performed impressively and rescued the agriculture sector to a great extent. With this background the present study aimed to know the crop shifts in Rayalaseema region of Andhra Pradesh.
For the purpose of the present study four districts in the Rayalaseema region viz., Chittoor, Y.S.R Kadapa, Ananthapuramu and Kurnool were selected. Time series data on area under different crops grown in these districts from the period from 1992-93 to 2016-17 were collected from Directorate of Economics and Statistics, Andhra Pradesh. A transition probability matrix was constructed for four districts using Markov chain analysis described below.
Markov chain analysis is an application of dynamic programming to the solution of a stochastic decision process that can be described by a finite number of states (Lakshmi and Devi, 2012). The Markov process was used to study the shifts in the cropping pattern and thereby gain an understanding about the dynamics of the changes. Markov chain analysis was carried out for a period from 1992-93 to 2016-17. Reddy and Lalith Achoth applied the Markova chain analysis to know the dynamics of the cropping pattern changes in Kerala.
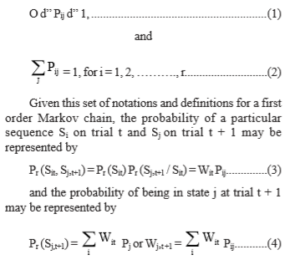
Any sequence of trails (experiments) that can be subjected to probabilistic analysis is called a stochastic process. For a stochastic process it is assumed that the movements (transitions) of objects from one state (possible outcome) to another are governed by a probabilistic mechanism or system. A finite Markov process is a stochastic process whereby the outcome of a given trial t (t = 1, 2,…….T) depends only on the outcome of the preceding trial (t-1) and this dependence is the same at all stages in the sequence of trials (Lee et al. 1965). Consistent with this definition, let
Si : represent the r state or possible outcomes; i = 1, 2, …., r.
Wit : represent the probability that state Si occurs on trial t or the proportion observed in trial t in alternative outcome state i of a multinomial population based on a sample of size n, i.e. Pr (Sit).
Pij : represent the transitional probability which denotes the probability that if for any time t the process is in state Si, it moves on next trial to state Sj, i.e.
Pr (Sj, t + 1/Sjt) = Pij.
P= (Pij): represent the transitional probability matrix which denotes the transitional probability for every pair of states (i, j = 1, 2, ….r) and has the following properties.
The proportions of area under the crops change from year to year as a result of the factors like weather, technology, price and institutional changes. It is reasonable to assume that the combined influence of these individually systematic forces approximates a stochastic process and the propensity of farmers to move from one crop state to another differs according to the crop state involved. If these assumptions are acceptable, then the process of cropping pattern change may be described in the form of a matrix P of first order transition probabilities. The element of Pij of the matrix indicates the probability a farmer in crop state i in one period will move to crop state j during the following period. The diagonal element Pij measures the probability that the proportion share of ith category of crop will be retained.
Equation (4) can be used as a basis for specifying the statistical model for estimating the transition probabilities. If errors are incorporated in equation (4) to account for the difference between the actual and estimated occurrence of Wj(t+1), the sample observations may be assumed to be generated by the following linear statistical model :
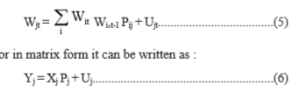
where, Yj is a (T × 1) vectors of observations reflecting the proportion in cropping pattern j in time t, Xj is a (T × r) matrix of realised values of the proportion in cropping pattern i in time t-1, Pj is a (r × 1) vector of unknown transition parameters to be estimated and Uj is a vector of random disturbances.
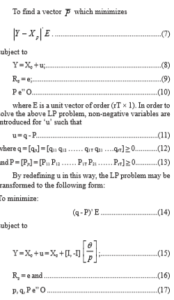
A method to derive parameter estimates when equality or inequality restrictions are present is to make use of Minimum Absolute Deviations (MAD) estimator. If we employ this method in obtaining estimates of the transition probabilities, our problem may be specified as follows:
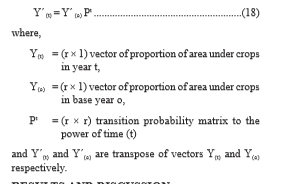
After estimating transition probability matrix (P), proportion of area under different crops can be predicted using the following equation.
The results of Markov chain analysis to find out changes in the direction of different crops in four districts were presented in the form of transition probability matrix. In the transition probability matrix rows shows the area of the corresponding crop lost to the other crops and columns indicate area gained from the other crops.
The transition probability matrix presented in Table 1 shows the changes in areas of different crops in Chittoor district. Among all the crops studied, the acreage under other crops retained fairly highest probability to the extent of 0.9520. The other crops in the district include potato, tomato, tamarind, beans, brinjal, mango, ragi, bajra, small millets and coconut. This retention of area was further reinforced by the gain from paddy (0.0791). The transfer probabilities from other crops to redgram, sunflower and chillies were 0.0402, 0.0054 and 0.0022.
Groundnut experienced a retention probability of 0.6243 and had gained a share of 0.8111 from sunflower, 0.7798 from sugarcane and 0.6564 from paddy. The probabilities of gains from groundnut were 0.3106 to paddy, 0.0594 to sugarcane, 0.0040 to redgram and 0.0014 to chillies.
The acreage under chillies had a retention probability of 0.5309 and sunflower was the only crop to which there was a transfer probability of 0.4691. It gained from paddy (0.0123), other crops (0.0022), groundnut (0.0014) and sugarcane (0.0010).
Redgram had retained to an extent of 0.3827. It lost its area share to only sugarcane crop with probability of 0.6172. It has gained shares of 0.0402 from other crops, 0.0105 from paddy and 0.0040 from groundnut.
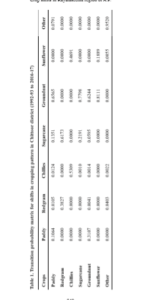
Sugarcane lost its major share to groundnut (0.7798) and negligible share to chillies (0.0010). However, it was benefited by gaining major share from redgram (0.6172), small share from paddy (0.1350) and negligible share from groundnut (0.0594) and had retention probability of 0.2191.
Regarding, sunflower having a retention probability of 0.1889 gained a major share from chillies (0.4691) and negligible share from other crops (0.0054). It lost its major share to only groundnut with probability of 0.8111.
A very low degree of retention probability of 0.1064 was observed in paddy. It had a transfer probability of 0.6564 to groundnut, while other crops, chillies and redgram gained to an extent of 0.0791, 0.0123 and 0.0105 respectively from paddy. Even it lost its major share to groundnut; it was benefited by getting share of 0.3107 from groundnut.
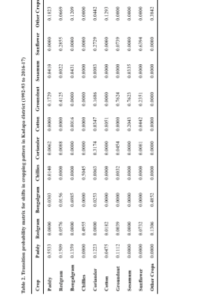
The results of Markov chain analysis to find out changes in the direction of different crops in Y.S.R. Kadapa district (Table 2) over the period (1992-93 to 2016-17) revealed that, cotton crop had highest retention probability to the extent of 0.8050 and fairly low transfer probability of 0.1293 to other crops, 0.0474 to paddy and 0.0181 to redgram. The other crops in the district include mango, lemon, papaya and onion. Further cotton has gained a share of 0.2042 from sesamum, 0.0441 from sunflower and 0.0346 from coriander.
Groundnut had a fair degree of retention probability of 0.7624 and a transfer probability to the extent of 0.1112 to paddy, 0.0739 to sunflower, 0.0454 to coriander, 0.0038 to redgram and 0.0032 to chillies. It has gained a share of 0.7622 from sesamum, 0.4124 from redgram, 0.2351 from sunflower, 0.1729 from paddy and 0.1685 from coriander.
Next to groundnut, bengalgram crop had retention probability of 0.6985 and has gained its major share from 0.4851 from other crops, 0.0303 from paddy, 0.0253 from coriander and 0.0156 from redgram. Bengalgram had a transfer probability of 0.1358 to paddy, 0.1208 to other crops and 0.0431 to sesamum.
Sunflower had a retention probability of 0.6393 and has gained share from redgram (0.2855), coriander (0.2729) and groundnut (0.0739). It lost to groundnut (0.2351), redgram (0.0732), cotton (0.0441) and coriander (0.0081).
Paddy crop with 0.5533 retention probability gained shares from redgram (0.1509), bengalgram (0.1358), coriander (0.1223), groundnut (0.1112) and cotton (0.0474) but a probability of 0.1822 to other crops, 0.1729 to groundnut, 0.0409 to sesamum, 0.0303 was lost to bengalgram and 0.0140 to chillies.
Chilli crop had a retention probability of 0.5044 and has slightly gained its share from 0.0140 from paddy, 0.0063 from coriander and 0.0032 from groundnut. Chilli had a transfer probability of 0.4955 to redgram only.
Coriander with 0.3173 retention probability gained shares from groundnut (0.0454), redgram (0.0088), sunflower (0.0081) and paddy (0.0062), but a probability of 0.2729 was lost to sunflower, 0.1685 to groundnut, 0.1223 to paddy, 0.0442 to other crops, 0.0346 to cotton and 0.0253 to bengalgram.
The transition probability matrix presented in Table 3 shows the changes in areas of different crops in Ananthapuramu district. Among all the crops studied, the acreage under groundnut retained fairly highest probability to the extent of 0.8737. This retention of area was further reinforced by the gains from sorghum (0.9546), sunflower (0.8753), chillies (0.8186), bengalgram (0.5373) and redgram (0.2195). The transition probabilities from groundnut to paddy, sorghum, bengalgram, sunflower and redgram were 0.0268, 0.0268, 0.0401, 0.0319 and 0.0004 respectively.
Cotton had the retention probability of 0.7737. It lost its area share to other crops, chillies and redgram to their respective probabilities of 0.1747, 0.0340 and 0.0175. It has gained shares of 0.1101 from maize and 0.0324 from redgram.
Regarding maize, the retention probability is 0.6708. It slightly gained shares from redgram and bengalgram with probabilities of 0.0551 and 0.0148 respectively. It lost major share to Bengalgram (0.2189) and cotton (0.1101).
Next to maize, ragi had retention probability of 0.6379 and it lost its share only to sorghum with transition probability of 0.3620 and gained a small share from paddy (0.0296) and sorghum (0.0071).
Paddy crop had retention probability of 0.5898 and it gained a small share from groundnut (0.0268) and lost to sunflower with 0.2232, redgram with 0.1034, chillies with 0.0537 and ragi with 0.0296.
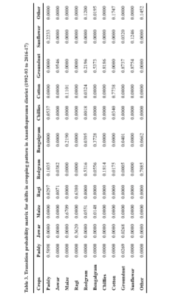
Redgram crop had retention probability of 0.5316. It lost its share to groundnut, other crops, maize, bengalgram, cotton and chillies to their respective probabilities of 0.2195, 0.1199, 0.0551, 0.0394, 0.0324 and 0.0018. It has gained a share of 0.7885 from other crops, 0.1814 from chillies, 0.1034 from paddy, 0.0556 from bengalgram, 0.0382 from sorghum, 0.0175 from cotton and 0.0004 from groundnut.
Bengalgram had a fair retention probability of 0.3727 and a transfer probability to the extent of 0.5373 to groundnut, 0.0556 to redgram, 0.0195 to other crops and 0.0148 to maize. It has gained a share of 0.2189 probabilities from maize, 0.0662 from other crops, 0.0401 from groundnut and 0.0394 from redgram.
Other crops had retention probability of 0.1452 and has gained share from cotton (0.1747), redgram (0.1199) and bengalgram (0.0195) but lost its share to redgram (0.7885) and bengalgram (0.0662).
Sunflower lost its major share to groundnut with transfer probability of 0.8753 and had retention probability of 0.1246. However, it gained shares from paddy and groundnut with 0.2232 and 0.0319 probabilities respectively.
Chillies and sorghum were highly unstable and they did not retain their areas. Both the crops had transfer probabilities of 0.8186 and 0.9546 to groundnut. Chilly crop gained through diversion of paddy, cotton and redgram with respective probabilities of 0.0573, 0.0340 and 0.0018, whereas sorghum gained shares from ragi (0.3620) and from groundnut acreage (0.0268).
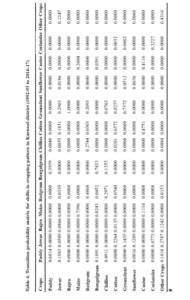
The results of Markov chain analysis to find out changes in the direction of different crops in Kurnool district (Table 4) over the period (1992-93 to 2016-17) revealed that, sunflower crop had retention probability to the extent of 0.8635 and fairly low transfer probability of 0.1288 to jowar, 0.0481 to coriander, 0.0121 to greengram and 0.0015 to paddy. The other crops in the district include bhendi, brinjal, tomato, mango, Batavia, crossandra and jasmine. Sunflower has gained a share of 0.0511 from groundnut and 0.0186 from jowar.
Next to sunflower, bengalgram crop had a retention probability of 0.7823 and gained its share from paddy and chillies at the rate of 0.3938 and 0.1354 probability respectively. Bengalgram had a transfer probability of 0.1090 to paddy, 0.0451 to redgram, 0.0391 to castor and 0.0242 to maize.
Groundnut retained to an extent of 0.7571, but has shifted its area towards jowar, sunflower and coriander with respective probabilities of 0.1435, 0.0511 and 0.0481. It was benefited with an entire share of (1.00) from bajra, 0.2963 from jowar, 0.2093 from redgram, 0.0763 from chillies and 0.0257 from cotton.
Maize had a fair degree of retention probability of 0.7395 and a transfer probability of 0.2604 to castor. It has gained a share of 0.1133 probabilities from castor and 0.0242 from bengalgram.
Cotton had retention probability of 0.6572 and low transfer probabilities of 0.2263 to jowar, 0.0540 to redgram, 0.0257 to groundnut, 0.0200 to chillies, 0.0134 to other bajra and 0.0031 to coriander. Cotton has gained major share of 0.4750 from castor, 0.1850 from jowar and 0.0303 from redgram.
Paddy crop with retention probability of 0.6013 lost its major share of 0.3938 to bengalgram and meager share to chillies (0.0047) but was further benefited by major share from chillies (0.4911), small share from jowar (0.1982), bengalgram (0.1090), other crops (0.1017) and negligible shares from sunflower (0.0015).
Redgram lost its shares to chillies (0.2743) followed by groundnut (0.2093) and cotton (0.0303) with retention probability of 0.4859. It gained to an extent from chillies (0.2970), cotton (0.0540), bengalgram (0.0451), jowar (0.0338) and other crops (0.0153).
Regarding, other crops having a retention probability of 0.4316, gained a very negligible share from crops like jowar (0.1247) and sunflower (0.0059). The area under jowar, bajra, paddy, chillies and redgram were benefited from other crops with a probability of 0.2787, 0.1241, 0.1017, 0.0484 and 0.0153 respectively.
Castor had retained to an extent of 0.4115 probability. It lost its area share to cotton and maize to their respective probabilities of 0.4750 and 0.1133. It has gained shares of 0.2604 from maize and 0.0391 from bengalgram.
Coriander had a fair degree of retention probability of 0.3227 and it gained to a small extent from groundnut (0.0481) and cotton (0.0031). Jowar was the only crop to which there was a transfer probability of 0.6772.
Jowar lost its major share of 0.6243 to only one crop i.e. groundnut. It gained small shares from cotton (0.1414), groundnut (0.1258) and negligible share from other crops (0.0454) with retention probability of 0.3756.
Chillies and bajra were observed as unstable crops in this period. Bajra lost its entire share (1.00) to groundnut and obtained a minor shares from other crops (0.1241), jowar (0.0866) and cotton (0.0134). Chilli lost its major share to paddy (0.4911), moderate share to redgram (0.2970), bengalgram (0.1354) and small share to groundnut (0.0763) and gained shares from redgram (0.2743), other crops (0.0484), cotton (0.0200), jowar (0.0055) and paddy (0.0047).
From the results it was inferred that in Chittoor district, among the stable crops groundnut was the crop that gained most from the shares of remaining crops, but the distinction was that it gained more than three fourth of the share of sunflower and sugarcane and more than half of the share of paddy. Among the unstable crops, paddy appears to have grabbed thirty per cent of the share of groundnut. It did not gain any share from all the other crops. In Y. S. R Kadapa district, among the stable crops groundnut was the crop that gained most from the shares of remaining crops, it gained maximum from sesamum, moderately from red gram and marginally from sunflower, paddy and cotton. But it did not gained anything from bengalgram, chillies, cotton and other crops. Among the unstable crops, redgram gained nearly half of the shares from chillies. Groundnut was the most stable crop in Ananthapuramu district with higher retention probability. Jowar, sesamum and sunflower were the highly unstable crops in the district, they lost their major share to groundnut. In Kurnool district sunflower was the most stable crop with high retention probability. But it gained very low shares from the remaining crops. Bengal gram was the next most stable crop in Kurnool. It gained reasonable shares from paddy and chillies. It did not gain anything from the remaining crop. Groundnut was also one of the highly stable crop in Kurnool district which gained 100 per cent shares from bajra and a reasonable shares from jowar and redgram.
The foregoing results revealed that groundnut was the most stable crop in the selected districts of the Rayalaseema region. This could be due to the prevailing favourable climatic condition and ease in groundnut crop husbandry. Groundnut requires a long warm growing season, well drained, fertile, sandy loam soils, rich in calcium and moderate in organic matter with pH ranging from 5.0 to 8.5 (Roy and Shiyani, 2000). Groundnut crop requires less fertilizer, less irrigation water and less management compared to rice and maize (Singh and Singh, 2009). The suitability of the climatic conditions, the socio-economic conditions of the farmers and their expertise in crop management with minimum resources undoubtedly made groundnut as the stable crop in the selected districts of the Rayalaseema region.
As groundnut is the most stable crop in Rayalaseema region of Andhra Pradesh, the Government has to provide good quality of inputs at right time in required quantity. Further developing the market infrastructural facilities along with the credit and crop insurance facilities will uplift the socio economic conditions of the Rayalaseema farmers.
Singh, N and Singh, A.K. 2009. Expansion of groundnut cultivation in rainfed farming system of north eastern hill region. In: Prakash, N et al., (eds). Sustainable Hill Agriculture, pp. 233-245. Today and Tomorrow printers and publishers New Delhi.
Roy, B.C and Shiyani, R.L. 2000. Rain-fed groundnut in India: Prioritizing production constraints and implication for future research. Bangladesh Journal of Agricultural Economics. 23(1&2): 19-34.
Reddy, D.R and Achoth, L. 2000. Dynamics of the cropping pattern changes in Kerala: A markov chain approach. Mysore Journal of Agricultural Sciences. 34: 376-381
Lakshmi, S.B.R and Devi, I.B. 2012. Crop shifts in coastal region of Andhra Pradesh: A markov chain approach. Agricultural Situation in India. 69(7): 363-368