
0 Views
Institute of Agribusiness Management, S.V. Agricultural College, ANGRAU, Tirupati – 517 502
The study was undertaken in one district i.e. Chittoor district of Andhra Pradesh. Andhra Pradesh state was chosen as the locale of the study, as the state ranks second in consumption of water-soluble fertilizers in India. Chittoor district extends over an area of 15,152 square kilometer. It was predominantly an agricultural district, and Andhra Pradesh contributes over 13.9% of Tomatoes production in India and the major producing areas are Kurnool, Chittoor, Visakhapatnam, and Prakasam districts.
KEYWORDS: WSF (Water Soluble Fertilizers), Constraints, Farmers, Buying.
Inadequate availability of urea and high prices of non-urea fertilizers posed significant challenges for farmers. However, the government’s new fertilizer sale and price policies in 2009 removed these constraints. Despite this, farmers are still not using the required amount of non-urea fertilizers due to a lack of motivation and knowledge. This low usage creates an imbalance in soil-plant systems, impacting crop yield. Non-urea fertilizers’ quality is often below standard, with high levels of adulteration. Urea production is declining, and imports are increasing to meet demand. The use of USG can significantly reduce prilled urea use during a fertilizer crisis. Therefore, any fertilizer crisis should be promptly investigated to suggest policy changes that solve the problem.
Looking to the constraints faced by the farmers, it can be concluded that farmers faced the constraints of high price and timely non-availability of the fertilizers. A large majority (86.67%) of the dealers faced the constraint of less bonus on more sales. Further, 80.00 per cent and 60.00 per cent dealers faced constraints of less commission and timely non-availability while selling fertilizers.
In terms of specialty fertilizers, Andhra Pradesh is the biggest market in the country. Several companies have entered this market for fertilizers after recognizing the state’s future potential for these fertilizers.
In Chittoor district farmers typically prefer to cultivate vegetables on small plots of one to two acres due to the extremely volatile nature of the vegetable market and the labour and capital requirements. The primary crops grown by small and marginal farmers are vegetables and sugarcane. Farmers frequently suffer significant losses when market excess causes prices to drop for vegetables, especially tomatoes, as there aren’t adequate cold storage facilities. With investments ranging from 25 to 40,000 per acre and potential returns of up to one or two lakhs per acre (assuming tomatoes sell for Rs.10 or Rs.12 per kg in the wholesale market), the stakes are high for the tomato industry.
The study was undertaken in one district i:e Chittoor district of Andhra Pradesh state. The Andhra Pradesh state was chosen as the locale of the study, as the state ranks second in consumption of water-soluble fertilizers in India.It was predominantly an agricultural district, and Andhra Pradesh contributes over 13.9% of Tomatoes production in India and the major producing areas are Kurnool, Chittoor, Visakhapatnam, and Prakasamdistricts. The sample size of farmers is 100. Both primary and secondary data has been collected for the study. A well-structured Interview schedule was developed based on the objective and the data was collected through personal interview.
When it was required to know the distribution pattern of respondents according to parameters some of the data were also interpreted in terms of their frequencies and percentages.
Garrett’s ranking technique was adopted for analysing the constraints in purchasing of products. In this method the respondents were asked to rank the factors identified for the purpose of study according to
their preferences. Thus, the assigned ranks are calculated by using the following formula.

where,
Rij = Rank given for ith variable by the jth individual.
Nj = Number of variables ranked by the jth individual.
For each calculated per cent position, scores were obtained from corresponding Garrett’s tables.
The farmers’ Constraints towards WSF (Water Soluble Fertilizers) was evaluated using a five-point rating scale. The rating scale included scores of 5, 4, 3, 2, and 1, corresponding to “strongly agree,” “agree,” “neutral,” “disagree,” and “strongly disagree,” respectively. Mean scores were calculated for each aspect, and ranks were assigned based on the obtained mean scores and standard deviations.
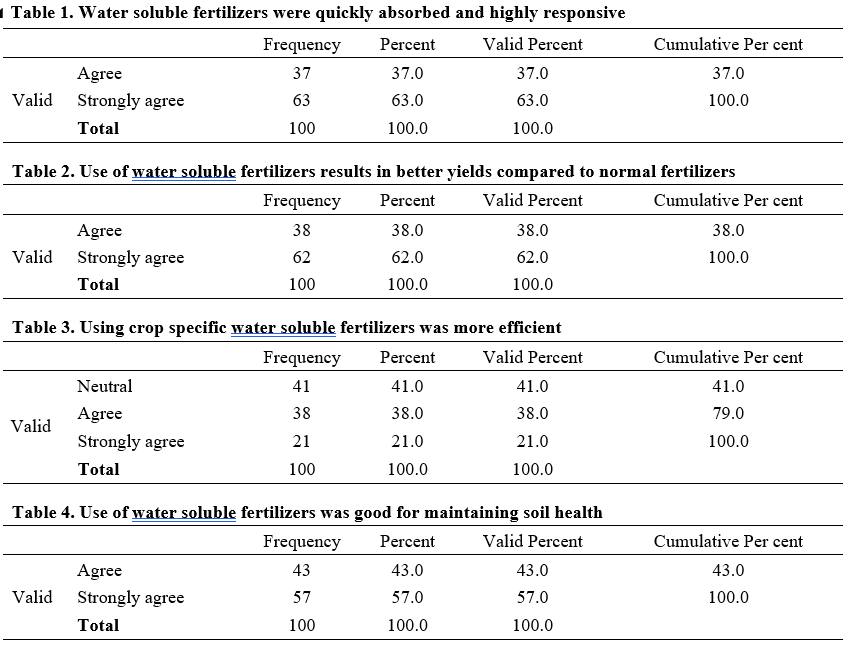
The table 1 shows the results regarding Water soluble fertilizers were quickly absorbed and highly responsive. 63% of respondents opined as strongly agree and 37% of them said as agree.
The table 2 shows the results regarding use of water soluble fertilizers results in better yields compared to normal fertilizers. 62% of respondents opined as strongly agree and 38% of them said as agree.
The table 3 shows the results regarding using crop specific water soluble fertilizers was more efficient. 41% of respondents opined as neutral, 21% of respondents opined as strongly agree and 38% of them said as agree.
The table 4 shows the results regarding use of water soluble fertilizers was good for maintaining soil health. 57% of respondents opined as strongly agree and 43% of them said as agree.
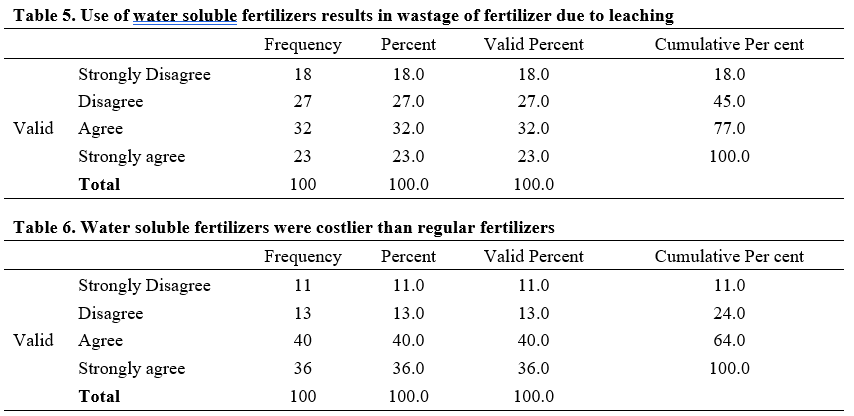
The table 5 shows the results regarding use of water soluble fertilizers results in wastage of fertilizer due to leaching. 23percent of respondents opined as strongly agree, 32percent of respondents opined as agree 27percent of respondents opined as disagree and 18percent of them said as strongly disagree.
The table 6 shows the results regarding water soluble fertilizers were costlier than regular fertilizers. 36% of respondents opined as strongly agree, 40% of respondents opined as agree, 13% of respondents opined as disagree and 11% of them said as strongly disagree.
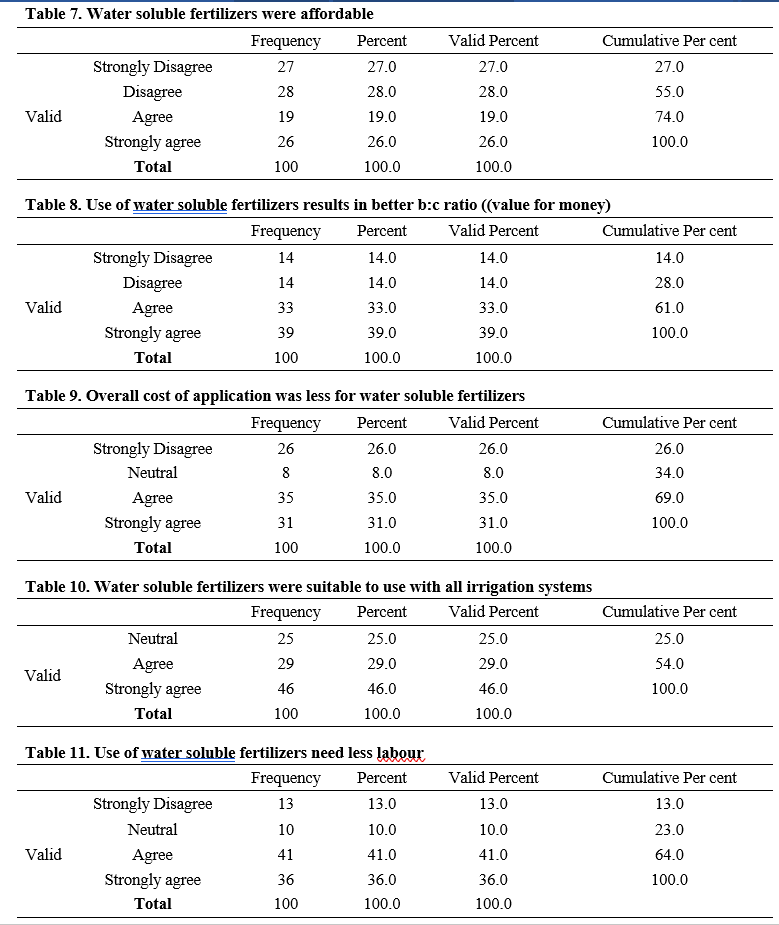
The table 7 shows the results regarding water soluble fertilizers were affordable. 26% of respondents opined as strongly agree, 19% of respondents opined as agree, 28% of respondents opined as disagree and 27% of them said as strongly disagree.
The table 8 shows the results regarding Use of water soluble fertilizers results in better b: c ratio ((value for money). 39% of respondents opined as strongly agree, 33% of respondents opined as agree, 14% of respondents opined as disagree and 14% of them said as strongly disagree.
The table 9 shows the results regarding Overall cost of application was less for water soluble fertilizers. 31% of respondents opined as strongly agree, 35% of respondents opined as agree, 8% of respondents opined as Neutral and 26% of them said as strongly disagree.
The table 10 shows the results regarding Water soluble fertilizers were suitable to use with all irrigation systems. 46% of respondents opined as strongly agree, 29% of respondents opined as agree and 25% of them said as Neutral.
The table 11 shows the results regarding Use of water soluble fertilizers need less labour. 36% of respondents opined as strongly agree, 41% of respondents opined as agree and 10% of them said as Neutral. 13% of respondents opined as strongly disagree.
The majority of farmers receive information about water-soluble fertilizers (WSF) from company sales representatives, and most farmers are knowledgeable about the efficient absorption and high responsiveness of WSF in crops. Farmers’ perceptions of WSF vary based on the type of crops they cultivate and the acreage for which they use WSF. In conclusion, it can be inferred that a significant number of farmers choose to purchase water-soluble fertilizers.
Amaliyar, K and Singh, R. 2016. A study on market potential, farmers’buying behaviour, and satisfaction level towards water soluble fertilizers in Anand and Narmada Districts of Gujarat. International Journal of Research in Business Management. 4: 27-36.
Jahiruddin, M., Islam, M and Miah, M.A. 2010. Constraints of Farmer’s Access to Fertilizer for Food Production. Final Report. 28-32.
Patel, J. 2017. Constraints Faced by the Farmers and Dealers in Purchasing and Selling Fertilizers in Banaskantha District of North Gujarat. International Journal of Agriculture Sciences. 9(3): 3683-3685.
Patil, U and Gaikwad, H. 2022. Farmers buying behavior toward the fertilizers. ASEAN Journal of Agriculture and Food Engineering. 1(1): 1-8. Sathish K,M., Maheta, H.Y., Lad, Y.A and Mahera,
A.B. 2022. Factors influencing banana growers to purchase water-soluble fertilizers in Trichy district, Tamil Nadu. British Journal of Marketing Studies. 10(4): 55-63.