
0 Views
Department of Genetics and Plant Breeding, S.V. Agricultural College, ANGRAU, Tirupati-517 502.
Thirty tomato genotypes were assessed in a randomized block design with three replications at S.V. Agricultural College, Tirupati, during rabi 2023-24, to assess the character associations between yield, Yield attributing and quality characters. The yield plant-1 recorded positive and significant correlation with days to 50 per cent flowering (0.33* and 0.27*), plant height (0.43** and 0.39**), fruit weight (0.30* and 0.23*), fruit diameter (0.35** and 0.28*), number of locules in fruit (0.26* and 0.22*) and seed test weight (0.60** and 0.37**) at genotypic and phenotypic levels respectively. The path coefficient analysis suggested that the characters like plant height, average fruit weight and seed test weight should be prioritized during selection to enhance the fruit yield plant-1 of tomato. Simultaneous selection for these characters would result in the improvement of yield plant-1.
KEYWORDS: Character association studies, Correlation, Path coefficient studies, Tomato.
Tomato (Solanum lycopersicum L.) is one of the most widely consumed vegetables worldwide. It is used for both fresh consumption and processing and is highly valued for their nutritional richness and culinary versatility. Keeping in view, the nutritional importance of the crop, breeding programmes should prioritize fruit quality alongside yield. With the growing population and the increasing demand for food coupled with limited arable land, enhancing crop productivity is crucial. India’s tomato productivity (25.33 t ha-1) is far below the world average (36.97 t ha-1) (FAOSTAT, 2022). Therefore, there is a necessity to develop high yielding varieties or hybrids with a focus on quality characters and suitability for processing. The interplay between yield related and quality related traits could provide insights that are valuable for breeding strategies aimed at meeting the increasing demand for high quality and high yielding tomato varieties. Yield is a complex character influenced by several contributing traits and their interactions. It is not only affected by various related characters, which are controlled by few genes, but is also significantly impacted by environmental factors. Understanding the correlations between yield, its components and quality character is necessary for effective selection in breeding programmes. However, total correlation is inadequate to explain the true association between characters. To gain a better understanding of yield components for effective selection programmes, it is desirable to take into account the relative magnitude of various characters. Path coefficient analysis, a standardized partial regression analysis developed by Wright in 1934, aids in breaking down the total correlation into direct and indirect effects, which is useful in selecting high yielding genotypes (Dewey and Lu, 1959). This study aims to elucidate the character associations and causal relationships among yield, yield components and quality traits. By employing both correlation and path coefficient analyses, the study aims to elucidate the factors most influential in determining yield and quality, providing valuable insights for breeders.
The present investigation was carried out at the S.V. Agricultural College, Tirupati during rabi, 2023-24 Thirty genotypes of tomato procured from Indian Institute of Vegetable Research, Varanasi were used in the experiment. The experimental material was evaluated using Randomized Block Design (RBD) with three replications. The genotypes were planted in a single row in each replication at a spacing of 60 × 45 cm with a row length of 4.5 m. Observations on various parameters viz., number of leaves at 30 DAT, days to 50 per cent flowering, number of clusters plant-1, days to 50 per cent fruit setting, number of fruits cluster-1, number of leaves at 60 DAT, internode length (cm), plant height (cm), number of primary branches plant-1, fruit length (cm), fruit diameter (cm), number of locules in fruit, pericarp thickness (mm), average fruit weight (g), fruit pH, total soluble solids (oBx), titratable acidity (%), ascorbic acid (mg/100g), lycopene content (mg/100g), beta-carotene (mg/100g), fruit shelf life, seed test weight (g) and yield plant-1 (kg) were recorded. The statistical analysis was performed for the mean data recorded on five randomly selected plants of each genotype from each replication. The statistical software used for analysis of data is WINDOSTAT 9.2. Genotypic and phenotypic correlation coefficients were calculated using the method given by Johnson et al. (1955) to determine the degree of association of the characters with yield and also among the yield components. Path coefficient analysis was carried out by the procedure originally proposed by Wright (1921) which was subsequently elaborated by Dewey and Lu (1959) to estimate the direct and indirect effects of the individual characters on fruit yield plant-1.
Phenotypic and genotypic correlations coefficients between yield, yield attributing and quality traits and inter correlations among different traits are presented in the Table 1 and Table 2.
The yield plant-1 recorded positive and significant correlation with days to 50 per cent flowering (0.33* and 0.27*), plant height (0.43** and 0.39**), fruit weight (0.30* and 0.23*), fruit diameter (0.35** and 0.28*), number of locules in fruit (0.26* and 0.22*) and seed test weight (0.60** and 0.37**) at genotypic and phenotypic levels respectively. A non-significant correlation was observed between the rest of the traits and yield plant-1.
The genotypes with higher days to 50 per cent flowering tends to have good vegetative growth and is able to photosynthesize and better translocation of the nutrients leading to increased yield. Taller plants also indicated good vegetative growth and usually support more fruits, enhancing overall yield. More number of locules indicated higher fruit diameter and average fruit weight.
Higher fruit diameter and fruit weight recorded large sized fruits which contributed directly to higher yield plant-1. Seed test weight reflects seed quality, plant vigour and productivity and hence impact yield plant-1.
The selection of traits showing positive and significant correlation with yield plant-1 will be effective in improving yield. The results in this study are in accordance with Khapte and Jansirani (2014), Meitei et al. (2014), Kumar et al. (2014) and Kumar and Jitendra (2024).
Direct and indirect effects of different yield component traits that showed significant correlation with yield plant-1 were estimated through path analysis. The results are presented in Table 3 and 4. The path diagrams are presented in figure 1 and 2.
In the present study, it was observed that the fruit weight (1.23 and 0.30) and seed test weight (1.13 and 0.34) had high positive direct effect on yield plant-1 at both genotypic and phenotypic level. Similar results were reported by Kadyan et al. (2023), Nevani and Sridevi (2022) and Sharma et al. (2024). The days to 50 per cent flowering (0.33) and number of locules in fruit (0.71) had high positive direct effect on yield plant-1 at the genotypic level whereas plant height (0.33) showed high direct effect at phenotypic level. These results were in accordance with Mitul et al. (2016). Conversely, negative direct effect was exhibited by fruit diameter (-1.49 and -0.06) at the genotypic and phenotypic level. The above results were in accordance with Khapte and Jansirani (2014), Nevani and Sridevi (2021), Sharma et al. (2024) and Kadyan et al. (2023).
The traits number of leaves at 30 DAT, number of leaves at 60 DAT, internode length, plant height and number of primary branches plant-1 are indicators of vegetative growth. Good vegetative growth is essential for achieving higher yields per plant. It enhances the capacity of the plant for photosynthesis, resulting in increased energy production. It is often associated with a well-developed root and vascular system, which leads to more efficient nutrient uptake and transport. Plants with strong vegetative growth are better equipped to produce and sustain higher yields. Out of these traits, plant height exhibited positive and significant correlation with yield plant-1 due to high direct effect. Therefore, simple selection for taller genotypes can lead to improvement in yield plant-1.
Reproductive traits such as days to 50 per cent flowering, number of clusters plant-1, days to 50 per cent fruit setting and number of fruits cluster-1 are crucial for maximising yield. Early flowering and fruit setting varieties are preferred by growers but earliness should not be at the cost of good vegetative growth. More number of clusters and fruits often reduce size and quality of
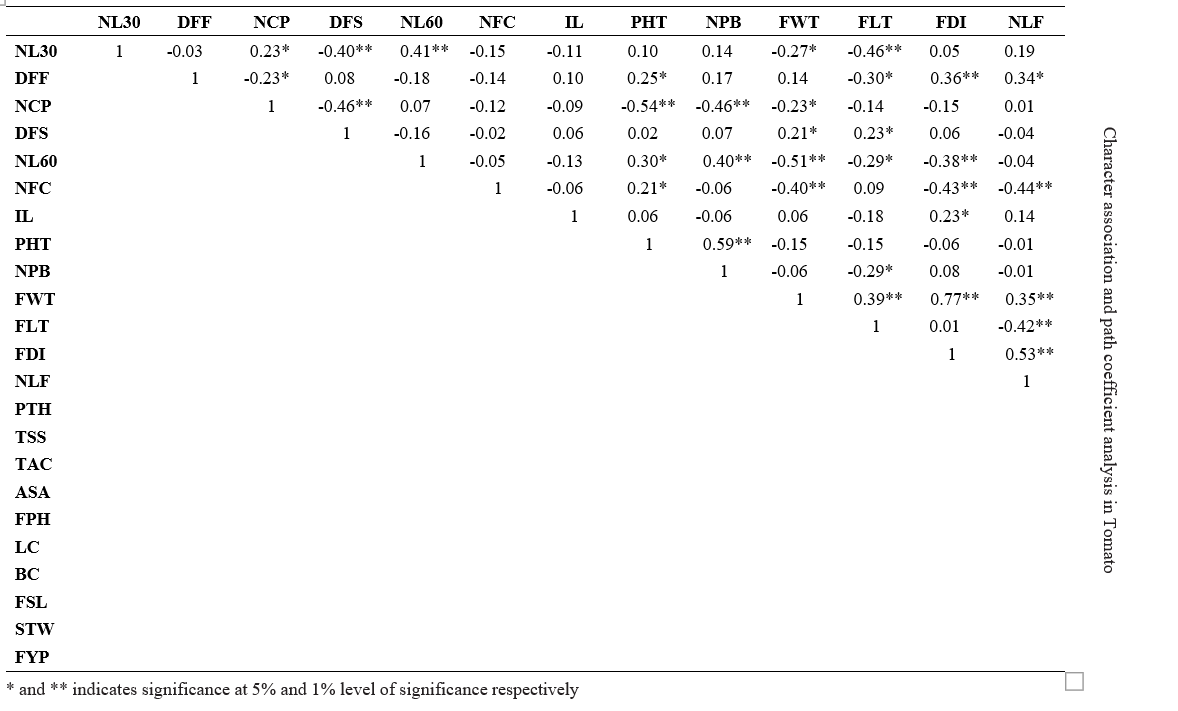

NL30 = Number of leaves at 30 DAT, NL60 = Number of leaves at 60 DAT , DFF = Days to 50% flowering, DFS = Days to 50% fruit setting, NCP= Number of clusters/plant, NFC = Number of fruits/cluster, IL = Internode length (cm), PHT = Plant Height (cm), NPB = Number of primary branches/plant, FWT = Average fruit weight(g), FLT = Fruit length(cm), FDI = Fruit diameter(cm), NLF = Number of locules in fruit, STW = Seed test weight (g), TSS = Total Soluble Solids (°Bx), TAC = Titratable Acidity (per cent ).ASA = Ascorbic Acid (mg/100g), FPH = Fruit pH, FSL = Fruit Shelf Life, LC = Lycopene Content (mg/100g), BC = Beta carotene (mg/100g), FYP = Yield/plant (kg).
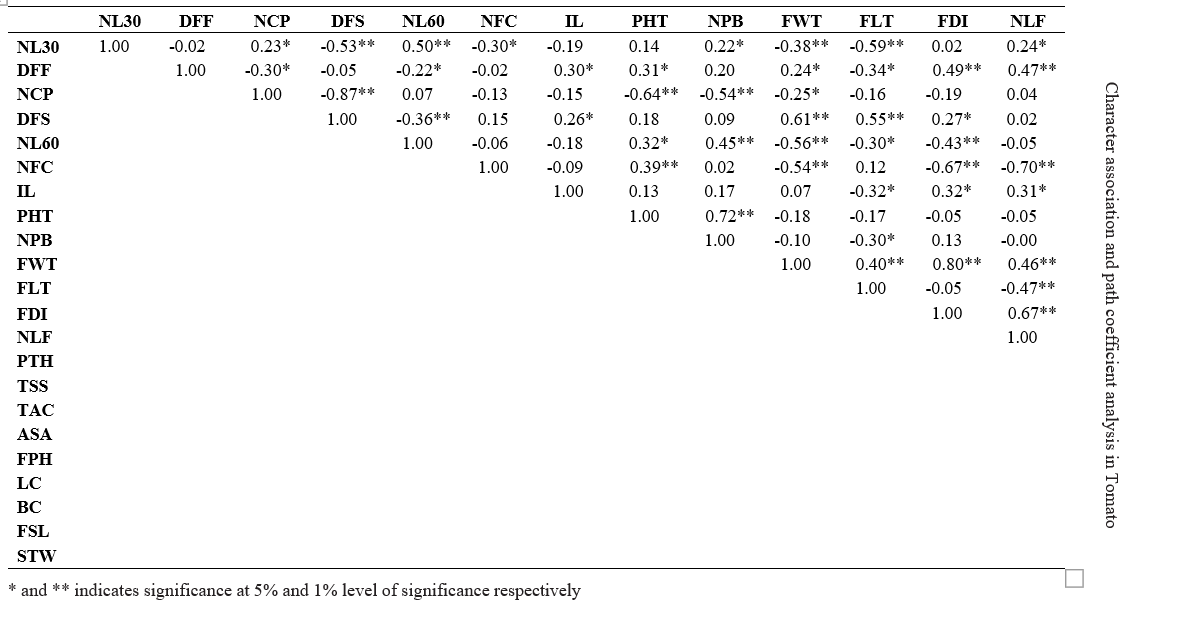

NL30 = Number of leaves at 30 DAT, NL60 = Number of leaves at 60 DAT , DFF = Days to 50% flowering, DFS = Days to 50% fruit setting, NCP= Number of clusters/plant, NFC = Number of fruits/cluster, IL = Internode length (cm), PHT = Plant Height (cm), NPB = Number of primary branches/plant, FWT = Average fruit weight(g), FLT = Fruit length(cm), FDI = Fruit diameter(cm), NLF = Number of locules in fruit, STW = Seed test weight (g), TSS = Total Soluble Solids (°Bx), TAC = Titratable Acidity (per cent ).ASA = Ascorbic Acid (mg/100g), FPH = Fruit pH, FSL = Fruit Shelf Life, LC = Lycopene Content (mg/100g), BC = Beta carotene (mg/100g), FYP = Yield/plant (kg).


* and ** indicates significance at 5per cent and 1per cent level of significance respectively.
DFF = Days to 50% flowering, PHT = Plant Height (cm), FWT = Average fruit weight(g), FDI = Fruit diameter(cm),
NLF = Number of locules in fruit, STW = Seed test weight (g) and FYP = Yield/plant (kg).
the fruit, reducing the overall yield plant-1. Out of these traits, days to 50 per cent flowering showed positive and significant correlation with yield plant-1 through indirect effect via plant height and number of locules in fruit. Fruit characteristic traits like fruit length, fruit diameter, number of locules in fruit, pericarp thickness, average fruit weight influence yield plant-1. The trait average fruit weight showed positive and significant correlation with yield plant-1 due to high direct effect. Fruit diameter and number of locules in a fruit manifested positive and significant correlation with yield plant-1 due to indirect effect via average fruit weight. Therefore, selecting the genotypes with higher average fruit weight might be a good strategy for improving yield plant-1.
In the present study, the fruit quality parameters like fruit pH, total soluble solids, titratable acidity, ascorbic acid, lycopene content, beta-carotene and fruit shelf life did not show any significant correlation with yield plant-1. This indicates that simultaneous improvement of both quality traits and yield could be taken up.
Seed test weight showed positive and significant correlation with yield plant-1 due to high direct effect. This trait can also be prioritized during selection to improve the yield plant-1.
The magnitude of residual effect was 0.241 and 0.298 at the genotypic and phenotypic level respectively, indicating that 94.2 per cent and 91.1 per cent of the variation in yield plant-1 could be interpreted by the six characters studied for path coefficient analysis.

Fig. 1. Phenotypic path diagram for six characters on fruit yield in tomato.
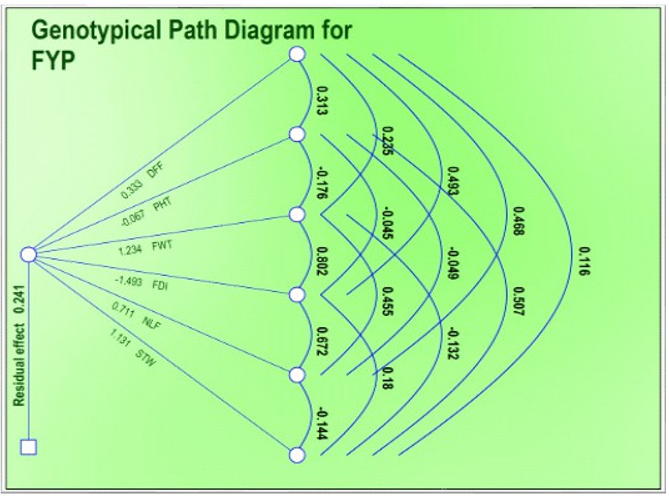
Fig. 2. Genotypic path diagram for six characters on fruit yield in tomato.
Based on the above investigation, it can be concluded that the fruit yield plant-1 had positive and significant association with days to 50 per cent flowering, plant height, fruit weight, fruit diameter, number of locules in fruit and seed test weight. The results of correlation and path coefficient analysis suggested that the traits plant height, average fruit weight and seed test weight should be prioritized during selection to enhance the yield plant-1 of tomato. These traits might be given more emphasis for direct selection of high yielding tomato genotypes in future tomato breeding programmes.
Dewey, D.R and Lu, K.H. 1959. A correlation and path‐coefficient analysis of components of crested wheatgrass seed production. Agronomy Journal. 51(9): 515-518.
FAOSTAT. 2022. Food and Agriculture Organization of the United Nations. http://www.fao.org/faostat/en/.
Johnson, H.W., Robinson, H.F and Comstock, R.E. 1955. Estimates of genetic and environmental variability in soybeans. Agronomy Journal. 47(7): 314-318.
Kadyan, D., Srivastav, P., Kumar, J and Singh, H. 2023. Genetic variability, correlation, and path coefficient analysis in tomato (Solanum lycopersicum L.). The Pharma Innovation Journal. 12(8): 2325-2329.
Khapte, P.S and Jansirani, P.P. 2014. Correlation and path coefficient analysis in tomato (Solanum lycopersicum L.). Electronic Journal of Plant Breeding. 5(2): 300-304.
Kumar, R., Ram, C.N., Yadav, G.C., Deo, C., Vimal,
S.C and Bhartiya, H.D. 2014. Studies on correlation and path coefficient analysis in tomato (Solanum lycopersicon L.). Plant Archives. 14(1): 443-447.
Kumar, S and Jitendra, S. 2024. Correlation and path coefficient analysis in tomato (Lycopersicon esculentum Mill.). Journal of Plant Breeding and Crop Science. 12(4): 232-237.
Meitei, K.M., Bora, G.C., Singh, S.J and Sinha, A.K. 2014. Morphology based genetic variability analysis and identification of important characters for tomato (Solanum lycopersicum L.) crop improvement. American-Eurasian Journal of Agricultural and Environmental Sciences. 14: 1105-1111.
Nevani, S and Sridevi, O. 2022. Genetic variability studies in tomato (Solanum lycopersicum L.) for yield and quality traits. Journal of Farm Sciences. 35(01): 33-36
Sharma, S., Jindal, S.K., Patel, S.A.H., Sharma, A and Chawla, N. 2024. Genetic association analysis in advance tomato (Solanum lycopersicum L.) lines for horticultural and yield contributing traits. Trends in Horticulture. 7(1).
Wright, S. 1921. Correlation and causation. Journal of Agricultural Research. 20: 557-585.