
0 Views
Department of Genetics and Plant Breeding, S.V. Agricultural College, ANGRAU, Tirupati – 517 502.
Character association and path co-efficient analysis were carried out using 25 genotypes of cowpea for 10 yield attributing traits. Character association analysis revealed that the characters number of pods plant-1, number of clusters plant-1, number of branches plant-1, 100 seed weight, days to 50 per cent flowering and days to maturity exhibited significant and positive association with seed yield plant-1 indicating that selection based on these characters would bring about simultaneous improvement of the yield. Path co-efficient analysis revealed that number of pods plant-1 exhibited the highest positive direct effect on seed yield plant-1 followed by100 seed weight, number of clusters plant-1, days to maturity, plant height, pod length, number of seeds pod-1 and number of branches plant-1indicating that direct selection of these characters would be rewarding for improvement of the yield.
KEYWORDS: Correlation, Path analysis, Seed yield
Cowpea [Vigna unguiculata (L.) Walp.] is an annual, autogamous leguminous crop belonging to family Leguminoseae with a diploid chromosome number of 2n= 22. Cowpea is considered as one of the oldest legumes and referred as “Poor man’s meat” as its seeds have high protein content making it extremely valuable in areas where many people cannot afford proteinaceous food like meat and fish. On dry weight basis, cowpea grain contains
23.4 per cent protein, 1.8 per cent fat, 60.3 per cent carbohydrates and is a good source of vitamins and phosphorus (Gupta et al., 2019).
Cowpea is an early, multi seasonal and multipurpose crop. It has multifarious uses like fodder, cover crop and green manure and provides high quality protein in the form of vegetable and pulse to human diet. All parts of cowpea are used as food and fodder. It is mostly cultivated as sole crop and mix-crop in India and also an ideal crop for soil and water conservation because of its fast growing and ground covering ability. It adjusts well in a variety of cropping system and also grown as catch crop and green manure crop as it fixes about 240 kg ha-1 atmospheric nitrogen and leaves about 60 to 70 kg nitrogen for succeeding crop (Panchta et al., 2020).
In India, cowpea is grown almost in all states, but the largest cultivating states are Gujarat, West Bengal,
Tamil Nadu, Andhra Pradesh, Kerala and Orissa (Detroja et al., 2020). In Andhra Pradesh, it is grown in an area of 0.13 lakh hectares with a production of 0.06 lakh tonnes and with a productivity of 487 kg ha-1 (Directorate of Economics and Statistics, Ministry of Agriculture and Farmers Welfare (DAC and FW), Government of India, 2019-20).
Knowledge on the interrelationship between the different morphological and yield contributing traits is necessary for drawing out sound breeding programmes for any crop. Seed yield, being a complex quantitative trait, is governed by a large number of genes and is greatly influenced by environmental fluctuations, therefore, selection of elite genotypes based on yield as such is not effective. Under such circumstances, a breeder has to find out some other characters which contribute to yield. Therefore, knowledge of association of characters with seed yield and among themselves and their direct and indirect effects upon the yield is very helpful and provides an effective measure in crop improvement programme of cowpea. Hence, the objective of the present study is to determine the correlation and path analysis to understand the degree and direction of association of different yield component traits with the seed yield in cowpea.
The present investigation was carried out with 25 diverse genotypes during Rabi, 2020, irrigated dry conditions, at Regional Agricultural Research Station (RARS), Tirupati. The total rainfall received during crop growth period was 304 mm and the total number of rainy days were 18 under the influence of North East Monsoon and no irrigation was given during the crop growth period. The experimental site is situated at an altitude of 189.2 m above MSL, 13°N latitude and 79°E longitude geographically.
The data was recorded on ten randomly selected plants taken from each replication for days to 50 per cent flowering, days to maturity, plant height (cm), number of branches plant-1, number of clusters plant-1, number of pods plant-1, pod length (cm), number of seeds pod-1, 100 seed weight (g) and seed yield plant-1 (g). The data collected on 10 yield and yield attributing traits was used to study the association and path analysis. Genotypic and phenotypic correlation coefficients were calculated using the method given by Johnson et al. (1955b). Path co- efficient analysis was carried out by the procedure originally proposed by Wright (1921), which was subsequently elaborated by Dewey and Lu (1959) to estimate the direct and indirect effects of the individual characters on yield.
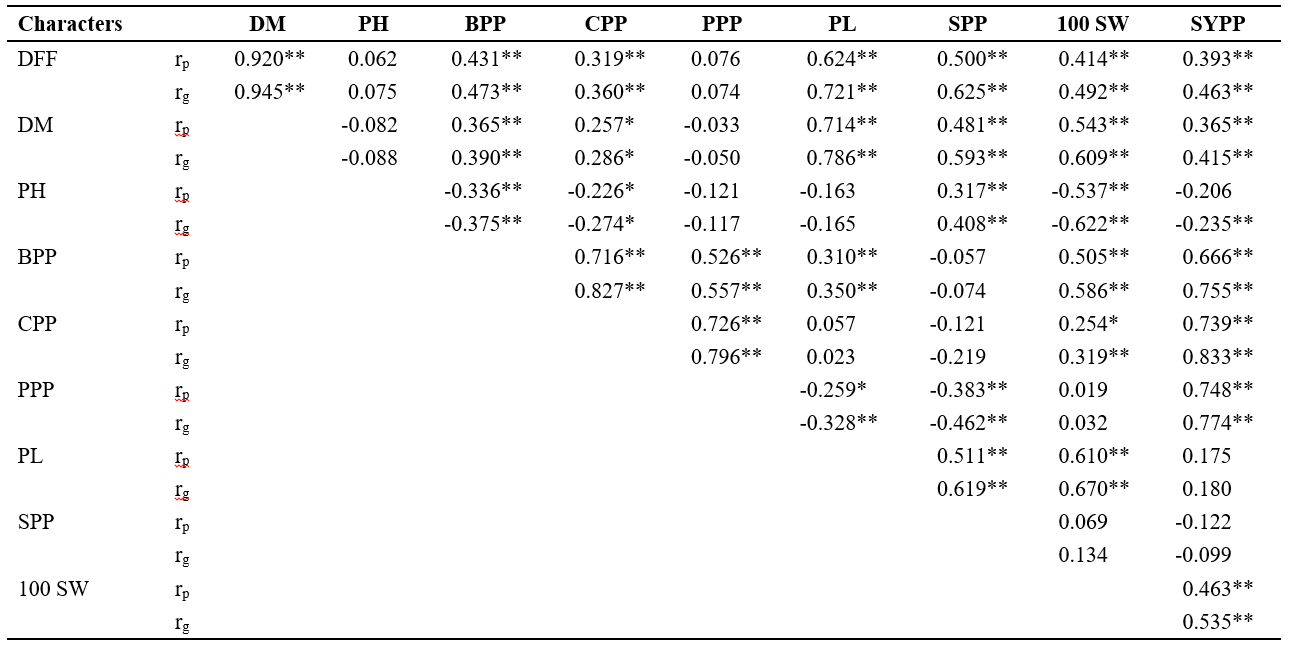
The phenotypic and genotypic correlation co- efficients were estimated to assess the direction and magnitude of association existing among seed yield and its attributes, which are presented in Table 1. It was found that genotypic correlation co-efficients were higher than that of phenotypic correlation co-efficients in the present study, which indicated higher degree of correlation between two characters at genotypic levels and the magnitude of phenotypic correlation co-efficient decreased due to environment effect.
The phenotypic and genotypic correlation studies between yield and yield component trait pairs among 25 genotypes revealed that, number of pods plant-1 (rp = 0.748** and rg = 0.774**), number of clusters plant-1 (rp = 0.739** and rg = 0.833**), number of branches plant-1 (rp = 0.666** and rg = 0.755**), 100 seed weight (rp = 0.463** and rg = 0.535**), days to 50 per cent flowering (rp = 0.393** and rg = 0.463**) and days to maturity (rp = 0.365** and rg
= 0.415**) recorded significant and positive association with seed yield plant-1.These results were in confirmity with Chaudhary et al. (2020) and Vijayakumar et al. (2020) for number of clusters plant-1 and number of pods plant-1; Chaudhary et al. (2020), Nagalakshmi et al. (2020) and Shanko et al. (2014) for number of branches plant-1; Vijayakumar et al. (2020) for 100 seed weight and Nagalakshmi et al. (2020) for days to 50 per cent flowering and days to maturity. The presence of a significant positive association between seed yield plant-1 and most of its component traits indicates that the situation is favourable from a breeding standpoint, implying that selecting for one trait may result in correlated responses for improvement of other traits that are positively associated with seed yield plant-1.
On contrary, number of seeds pod-1 (rp = -0.122 and rg = -0.099) and plant height (rp = -0.206 and rg = -0.235*) had a negative and non-significant association with seed yield plant-1. Further, pod length (rp = 0.175 and rg = 0.180) recorded positive and non-significant association with seed yield plant-1. The negative association of plant height and number of seeds pod-1 with seed yield plant-1 was in accordance with Panchta et al. (2020) for plant height; Sharma et al. (2017) and Shanko et al. (2014) for number of seeds pod-1.
For developing an efficient breeding strategy, in addition to identification of yield attributing traits showing positive and significant association with grain yield, the information about the association of yield attributes with each other is also essential. Interrelationship between yield characters revealed that days to 50 per cent flowering had significant positive association with days to maturity, number of branches plant-1, number of clusters plant-1, pod length, number of seeds pod-1 and 100 seed weight; days to maturity with number of branches plant-1, number of clusters plant-1, pod length, number of seeds pod-1 and 100 seed weight; plant height with number of seeds pod- 1; number of branches plant-1 with number of clusters plant- 1, number of pods plant 1, pod length and 100 seed weight; number of clusters plant-1 with number of pods plant-1 and 100 seed weight; pod length with number of seeds pod-1 and 100 seed weight indicating the interdependency of these characters. Therefore, the genotypes with these characters could be considered during selection for improving the respective characters which simultaneously improves seed yield plant-1.
| DFF : Days to 50% flowering | DM : Days to maturity | PH : Plant height | BPP : Number of branches plant-1 |
| CPP : Number of clusters plant-1 | PPP : Number of pods plant-1 | PL : Pod length | 100 SW : 100 Seed weight |
| DFF : Days to 50% flowering | DM : Days to maturity | PH : Plant height | BPP : Number of branches plant-1 |
| CPP : Number of clusters plant-1 | PPP : Number of pods plant-1 | PL : Pod length | 100 SW : 100 Seed weight |
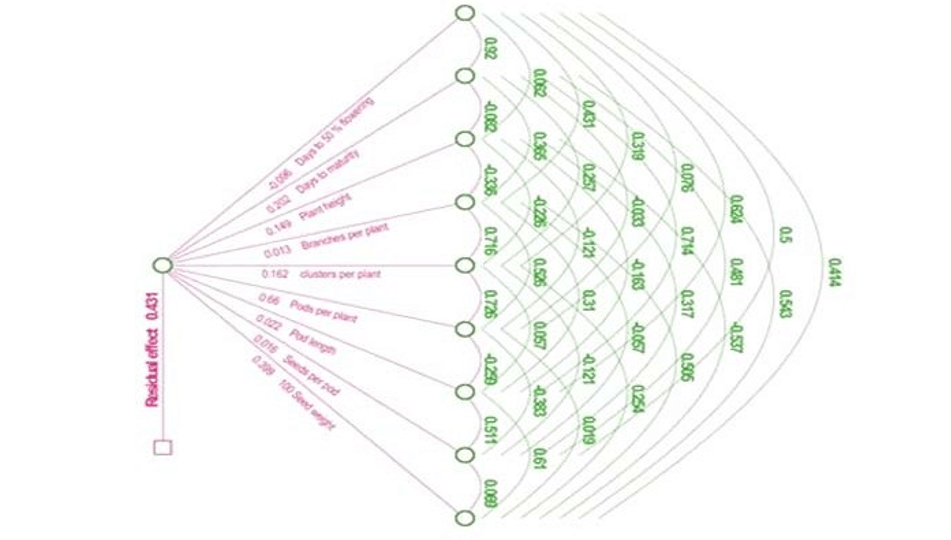
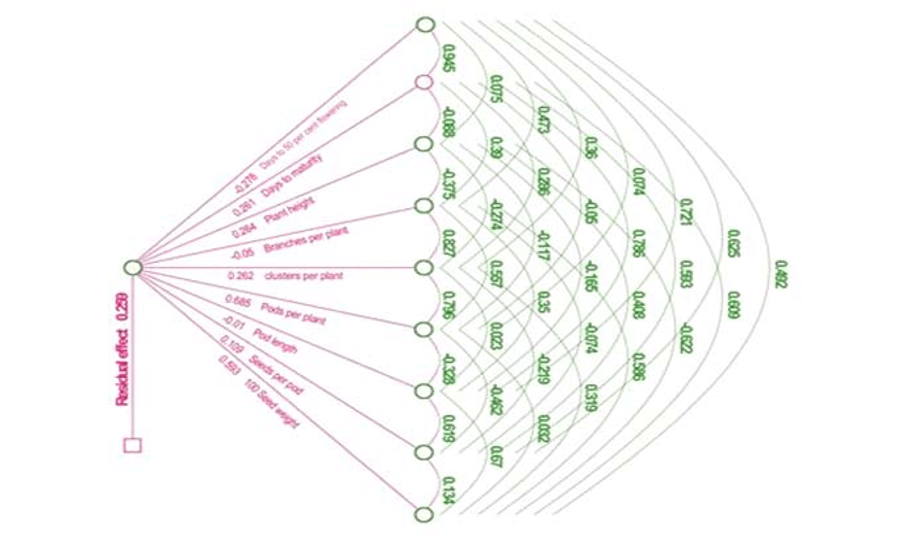
Figure 2. Genotypic path diagram of yield and yield attributing character in cowpea.
On the basis of correlation studies, it is suggested that more emphasis should be given on number of pods plant-1, number of clusters plant-1, number of branches plant-1, 100 seed weight, days to 50 per cent flowering and days to maturity for improvement of seed yield in cowpea as these characters showed strong correlation with seed yield plant-1.
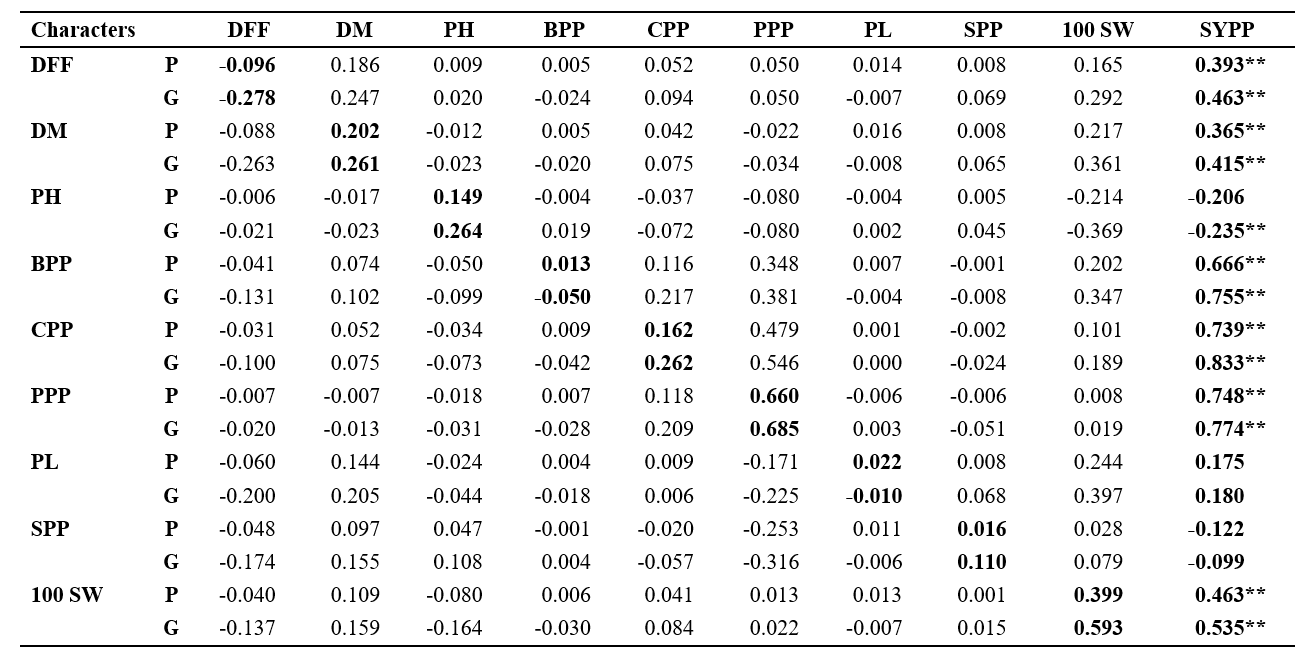
Correlation alone can only reveals the direction and magnitude of the association between any two characters but the path coefficient analysis helps in partitioning the correlation into direct and indirect effects of various yield components on yield Therefore, correlation studies coupled with path coefficient analysis are a powerful tool to study the character association and their final impact on yield, which helps the selection procedure accordingly. The path co-efficient analysis of yield and yield attributes was analyzed and provided in Table 2. The phenotypic and genotypic path diagram of yield attributing characters is presented in Figure 1 and Figure 2, respectively. In the present study, it was noted that the characters number of pods plant-1 (P = 0.660 and G = 0.685), 100 seed weight (P = 0.399 and G = 0.593), days to maturity (P = 0.202 and G = 0.261), number of clusters plant-1 (P = 0.162 and G = 0.262),plant height(P = 0.149 and G = 0.264), number of seeds pod-1 (P = 0.016 and G = 0.110), pod length (P =
0.022 and G = -0.010) and number of branches plant-1 (P
= 0.013 and G = -0.050) had positive direct effect on seed yield plant-1indicating that direct selection of these characters would be rewarding for improvement of yield.
Conversely, negative direct effect on seed yield plant- 1 was exhibited by days to 50 per cent flowering (P = –
0.096 and G = -0.278) but its association with seed yield plant-1 was found to be positive and significant which could be attributed to the indirect influence of days to maturity, 100 seed weight, number of pods plant-1, number of clusters plant-1, pod length, plant height, number of seeds pod-1 and number of branches plant-1 resulting in mutual cancellation of their negative effects. The negative direct effect of days to 50 per cent flowering on seed yield plant-1 was in accordance with Panchta et al. (2020), Sharan et al. (2017), Khandait et al. (2016) and Nawab et al. (2008).
The phenotypic residual effect was 0.431, while genotypic residual effect was 0.259 indicating that the characters included in the present study are contributing 60 per cent of variability pertaining to the dependent variable i.e. seed yield plant-1. Hence, along with the
characters under the consideration, some additional characters viz., dry matter content, biological yield, harvest index, pod weight, pod yield plant-1 and number of pods cluster-1which may also contribute toyield should also be included in future breeding programme.
Considering the nature and magnitude of character association and their direct and indirect effects, it can be concluded that the simultaneous improvement of seed yield plant-1 is possible through the improvement of number of pods plant-1, number of clusters plant-1, number of branches plant-1, 100 seed weight, days to 50 per cent flowering and days to maturity which also had positive direct effects on seed yield plant-1. It is therefore, suggested that preference should be given to these traits in the selection programme to improve seed yield in cowpea.
Chaudhary, A.R., Solanki, S.D., Rahevar, P.M and Patel,
D.A. 2020. Genetic variability, correlation and path coefficient analysis for yield and its attributing traits in cowpea [Vigna unguiculata (L.) Walp.] accessions. International Journal of Current Microbiology and Applied Sciences. 9(2): 1281-1293.
Detroja, D.H., Thakor, D.M., Baldaniya, V.G., Soni, N.V and Patel, P.C. 2020. Association analysis of morpho- physiological traits in vegetable cowpea (Vigna unguiculata (L.) Walp.). Electronic Journal of Plant Breeding. 11(3): 954-959.
Dewey, D.R and Lu, K.H. 1959. A correlation and path coefficient analysis of components of crested wheatgrass seed production. Agronomy Journal. 51: 515-518.
Gupta, R.K., Arya, M., Kumar, A and Kumari, P. 2019. Study on genetic variability in cowpea [Vigna unguiculata (L.) Walp]. Current Journal of Applied Science and Technology. 33(2): 1-8.
Johnson, H.W., Robinson, H.F and Comstock, R.E. 1955. Genotypic and phenotypic correlations in soybean and their implications in selection. Agronomy Journal. 47: 477-483.
Khandait, R., Jain, P.K., Prajapati, S and Dangi, A.S. 2016. Correlation and path co-efficient analysis for yield and it’s attributing traits in diverse genotypes of cowpea [Vigna unguiculata (L.) Walp.]. International Journal of Bio-resource and Stress Management. 7(1): 8-17.
Nagalakshmi, R., Kumari, R.U and Kumar, R.A. 2020. Correlation and path analysis in cowpea (Vigna unguiculata (L.) Walp.). 15(3): 397-401.
Nawab, N.N., Subhani, G.M., Khalid, M., Shakil, Q and Saeed, A. 2008. Genetic variability, correlation and path analysis studies in garden pea (Pisum sativum). Journal of Agricultural Research. 46(4): 333-340.
Panchta, R., Arya, S., Dalvinder, P.S., Satpal, P and Kumar,
Shanko, D., Andargie, M and Zelleke, H. 2014. Interrelationship and path co-efficient analysis of some growth and yield characteristics in cowpea (Vigna unguiculata (L.) Walp.) genotypes. Journal of Plant Sciences. 2(2): 97-101.
Sharan, P., Vyas, M., Sharma, P and Meghawal, D. 2017. Character associations between seed yield and its components traits in cowpea (Vigna unguiculata (L.) Walp.). Annals of Plant and Soil Research. 19(2): 168-174.
Sharma, P.P., Baranda, B., Haritwal, S and Sharma, M. 2017. Character association for seed yield and its components in cowpea (Vigna unguiculata (L.) Walp.). International Journal of Current Microbiology and Applied Sciences. 6(9): 967-975.
Vijayakumar, E., Thangaraj, K., Kalaimagal, T., Vanniarajan, C., Senthil, N., Jeyakumar, P and Souframanien, J. 2020. Inter relationship between yield and its attributing traits in cowpea (Vigna unguiculata (L.) Walp.) germplasm accessions. International Journal of Current Microbiology and Applied Sciences. 9(5): 194-200.
Wright, S. 1921. Correlation and causation. Journal of Agricultural Research. 20: 557-585.