
0 Views
Department of Agricultural. Economics, S.V. Agricultural College, ANGRAU, Tirupati-517 502.
The transition toward sustainable agriculture has increased the adoption of biofertilizers as an eco-friendly alternative to chemical fertilizers in paddy cultivation. This study investigates the biofertilizer supply chain originating from the Regional Agricultural Research Station (RARS), Tirupati, and evaluates associated risks using a hybrid approach of Petri Nets and Failure Mode Effects and Criticality Analysis (FMECA). Two key distribution pathways were assessed: Pathway 1 (via Krishi Vigyan Kendras and DAATT Centres) and Pathway 2 (direct supply to farmers). Petri Net models were used to visualize supply flows, while FMECA identified and ranked potential failure modes based on their severity, occurrence and detection difficulty. The most critical risks included delays in input supply at the production level (RPN = 336), limited rural supply centres (RPN = 280), and distribution inefficiencies through intermediaries (RPN = 224). Comparative analysis revealed that Pathway 2 was more efficient and resilient, offering better quality control, reduced delivery delays and improved farmer outreach. The study concludes that direct distribution, combined with expanded supply infrastructure and targeted farmer training, can significantly enhance biofertilizer adoption and support sustainable rice production in Andhra Pradesh..
KEYWORDS: Biofertilizers, Supply Chain, Petri Nets, FMECA, Risk Analysis.
Agriculture remains one of the most vital human activities, essential for ensuring food security and sustaining livelihoods. Among food crops, rice (Oryza sativa L.) holds a critical role as the staple food for more than half of the global population, especially in Asia. In India, rice production has shown aconsistent upward trend, with an estimated output of 13.78 lakh tonnes in 2023– 24, an increase of over 20 lakh tonnes from the previous year (Ministry of Agriculture and Farmers Welfare, 2023). Projections indicate that global rice production needs to reach 3.9 billion tonnes by 2030 and over 4.1 billion tonnes by 2050 to meet the growing food demand (Garai et al., 2013; Mohanty et al., 2013). To address this challenge, the agricultural sector has increasingly relied on inputs such as chemical fertilizers and pesticides to enhance productivity. However, the excessive use of such inputs poses significant environmental risks and threatens long-term soil health and ecosystem stability. In response, there is a growing emphasis on integrated nutrient management strategies that combine chemical inputs with sustainable alternatives like biofertilizers. Biofertilizers enhance crop yields, improve soil fertility, and reduce environmental harm, making them an essential component of sustainable rice production.
India has significantly ramped up biofertilizer production in recent years. In 2020–21, the country produced 1,34,323 tonnes of solid carrier-based biofertilizers and 26,442 kilolitres of liquid biofertilizers. These numbers increased to 1,69,379 tonnes and 2,32,934 kilolitres respectively in 2021–22 (Khurana & Kumar, 2022). Notably, South India, including Andhra Pradesh, contributes a major share to this production. In Andhra Pradesh, ANGRAU (Acharya N.G. Ranga Agricultural University) plays a pivotal role in the biofertilizer supply chain by producing and distributing biofertilizers to farmers at affordable prices under initiatives like RKVY (Rashtriya Krishi Vikas Yojana). ANGRAU produces and markets seven types of biofertilizers through schemes like NFSM and NMOOP, with a total production capacity of 650 MT (solid) and 600 MT (liquid) annually. These biofertilizers are distributed through a supply chain that originates from RARS (Regional Agricultural Research Station), Tirupati, reaching farmers across the state.
In this study, a hybrid framework combining Petri Nets (PN) and Failure Mode Effects and Criticality Analysis (FMECA) was employed to model, simulate and analyse risks in the supply chain network of biofertilizers originating from RARS, Tirupati. This approach was chosen due to its capacity to effectively handle dynamic, concurrent, and distributed systems, particularly under conditions of uncertainty and disruption, as commonly observed in agricultural supply chains.
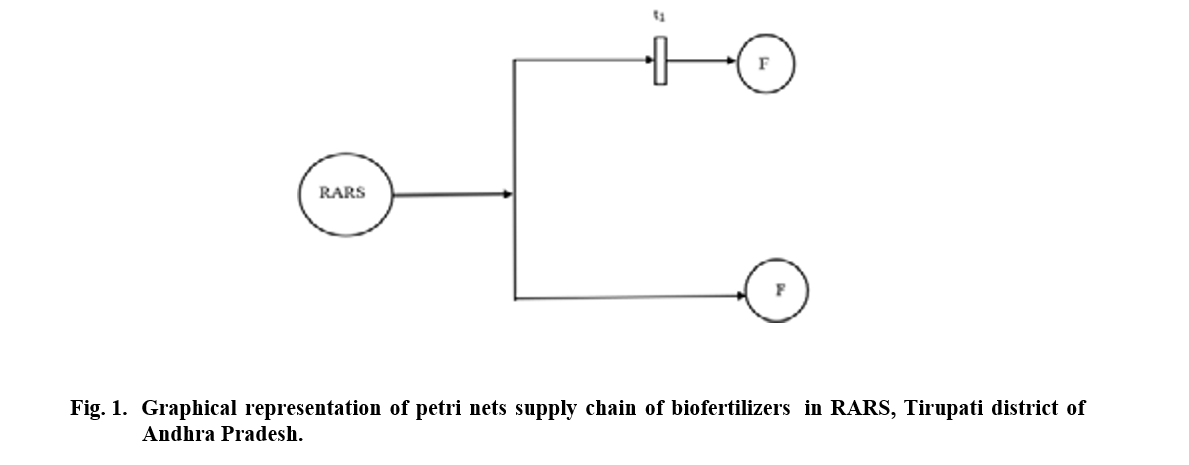
Petri Nets are a powerful modelling tool that represent systems both graphically and mathematically, making them particularly suitable for understanding the flow of materials and information. A Petri Net consists of places, transitions, and tokens. In the supply chain context:
The PN model provides a visual and analytical framework that captures the sequence and interdependence of supply chain activities. Its strength lies in modelling asynchronous and parallel events while also allowing for simulation of disruption scenarios.
This model was developed to track the biofertilizer flow from production at ANGRAU to delivery to farmers. It enables continuous monitoring and highlights disruptions such as delays in transport, supply shortages or increased demand. The model facilitates decision- making by providing real-time system status and impact assessment of different risk scenarios.
To complement the Petri Net model and enhance risk analysis, the Failure Mode Effects and Criticality Analysis (FMECA) method was integrated. FMECA is a widely recognized technique in reliability engineering, used to identify, evaluate and prioritize potential failure modes in a system. It provides a structured approach to anticipate possible failures in the supply chain and design mitigation strategies accordingly.
The FMECA process in this study followed four main steps:
biofertilizer supply chain such as production delays, poor storage conditions or inadequate transportation were identified through field observations and stakeholder interviews.
evaluated using three parameters:
Severity (S): The seriousness of the effect of the failure.
Occurrence (O): The likelihood of the failure happening.
Detection (D): The likelihood of the failure being detected before it impacts the supply chain.
RPNi= Si×Oi×Di
where,
RPNi is the risk priority number for the ith subsystem,
Si is the severity index,
Oi is the probability of occurrence, and
Di is the detection difficulty.
Higher RPN values indicate more critical risks requiring immediate attention. This step allowed for the identification of bottlenecks and vulnerabilities in the system, directing focus toward high-impact failure modes.
The supply chain of biofertilizers from the Regional Agricultural Research Station (RARS), Tirupati, is a crucial component in promoting sustainable agriculture in Andhra Pradesh. This supply chain has been analysed as part of ANGRAU’s initiative to encourage the adoption of biofertilizers among paddy farmers. The study focuses on two primary distribution pathways: one involving intermediary agencies (Pathway 1) and the
other involving direct sales to farmers (Pathway 2). To understand the interactions and flow of biofertilizers, a Petri Net model was developed, and a comprehensive risk assessment using Failure Mode, Effects and Criticality Analysis (FMECA) was conducted.
The supply chain is structured into two main channels: Pathway 1
RARS → Intermediary Agencies (KVK’s, DAATT Centres)
→ Farmers
Pathway 2
RARS → Farmers (Direct supply, no intermediaries)
Pathway 1: The supply of biofertilizers begins at the Regional Agricultural Research Station (RARS). RARS provides biofertilizers directly to Krishi Vigyan Kendras (KVK’s) and DAATT Centres. These act as authorized distribution points in the supply chain. From the KVK’s and DAATT Centres biofertilizers are further distributed to farmers engaged in paddy cultivation.
Pathway 2 : Some farmers visit RARS and directly buy the biofertilizers for cultivation of paddy without any intermediaries.
Places: RARS (production), Farmers (end-users)
Transition: Intermediary agencies (KVKs, DAATT Centres) present in Pathway 1
Arcs: Represent the transfer of biofertilizers between stages.
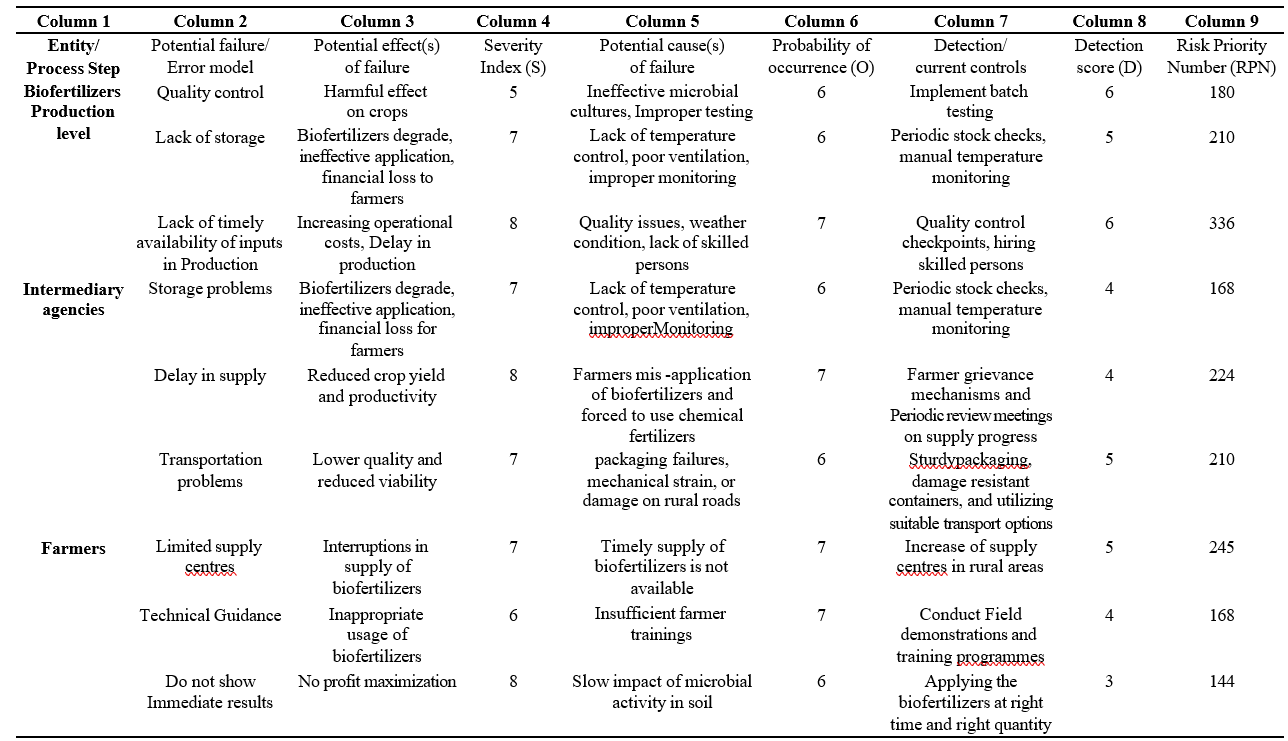
To identify key risks in the supply chain, stakeholder interviews were conducted and FMECA tables were developed for both pathways. Each subsystem (production, intermediary agencies, and farmers) was analysed for potential failure modes, their effects, causes, severity, occurrence, detection difficulty and recommended mitigation measures. The Risk Priority Number (RPN) was used to rank the criticality of each failure mode.
From Table 1, in pathway 1, the biofertilizer supply chain involves three key stakeholders: the production unit, intermediary agencies (KVKs and DAATT Centres) and farmers. At the production level, the most critical failure mode was the lack of timely input supply (RPN = 336), caused by supplier delays, weather variability and labour shortages. This was followed by inadequate storage (RPN = 210) and quality control failures (RPN = 180), which can compromise microbial viability and crop outcomes. At the intermediary level, significant risks included delays in supply (RPN = 224), transportation issues due to poor packaging and road conditions (RPN = 210) and suboptimal storage environments (RPN = 168), all of which reduced the effectiveness and timely
availability of biofertilizers. At the farmer level, limited access to supply centres (RPN = 245) was the most pressing issue, alongside insufficient technical guidance (RPN = 168) and the perception of delayed results (RPN = 144). Overall, the highest risks in this pathway stem from production delays and access constraints, while moderate risks related to storage, transportation, and farmer awareness can be mitigated through infrastructure improvements, supply chain coordination, and farmer training initiatives. These findings are similar with Ahu et al. (2016) study revealed critical failure modes such as supplier delivery delays and lack of skilled manpower. These risks had high Risk Priority Numbers (RPNs), indicating significant impacts on supply chain performance.
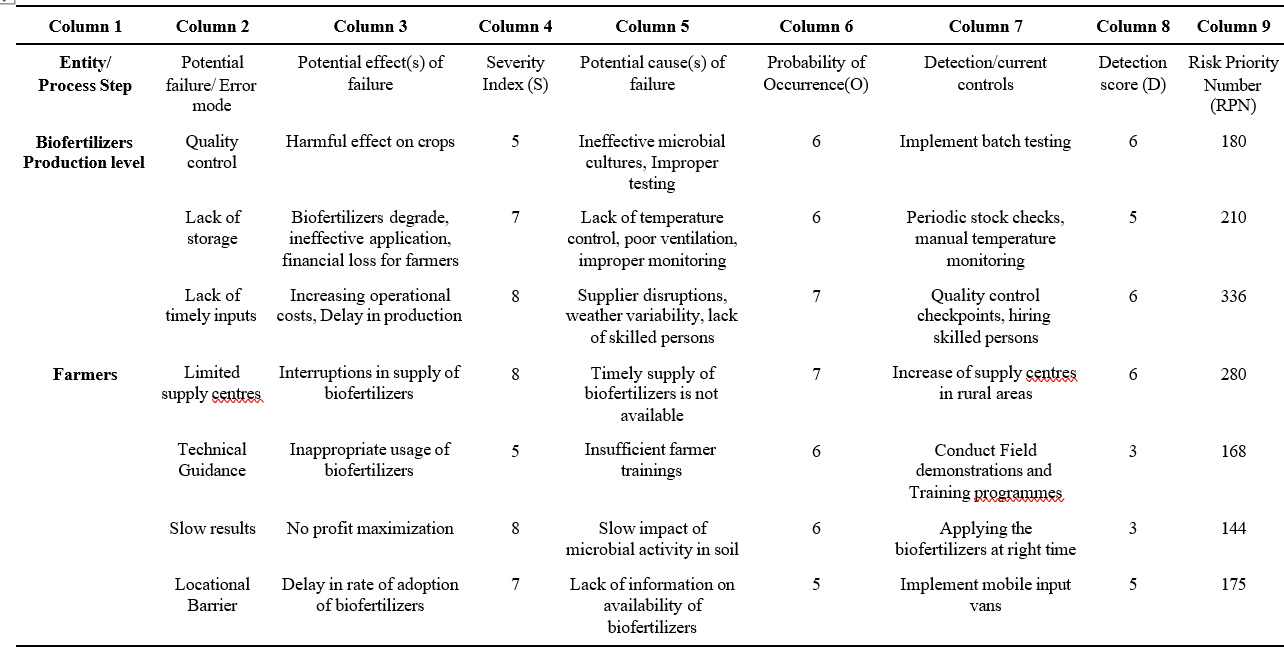
From Table 2, in pathway 2, the biofertilizer supply chain involves only two key stakeholders: the production unit (RARS, Tirupati) and farmers, making it a more streamlined model. At the production level, the critical risks mirrored those in Pathway 1, with the most severe being delays in input supply (RPN = 336), followed by inadequate storage (RPN = 210) and quality control failures (RPN = 180), all of which impact the quality and availability of biofertilizers. At the farmer level, the most pressing issue was limited access to supply centres (RPN = 280), which restricts timely procurement. Other moderate risks included lack of technical guidance (RPN = 168), slow or delayed results from application (RPN = 144) and locational or awareness barriers (RPN = 175). Despite these risks, Pathway 2 proved to be more effective than Pathway 1. Direct distribution from the production unit ensured better quality control, reduced intermediary-induced delays, and allowed for more efficient farmer training and technical support. This integrated system enhanced both product reliability and farmer adoption. Overall, the simplified structure and direct engagement with farmers made Pathway 2 more robust and sustainable model for biofertilizer supply. These findings are similar with Shanks et al., (2020).
This study assessed the supply chain of biofertilizers from the Regional Agricultural Research Station (RARS), Tirupati, using a combination of Petri Net modelling and Failure Mode Effects and Criticality Analysis (FMECA). Two distribution pathways were evaluated: one involving intermediary agencies such as KVKs and DAATT Centres (Pathway 1), and another involving direct distribution to farmers (Pathway 2). The most critical failure identified in both pathways was the delay in the availability of raw inputs at the production stage (RPN = 336), followed by storage and quality control issues. In Pathway 1, risks extended further down the chain, with significant problems including delays at intermediary agencies (RPN = 224), limited supply centres (RPN = 245) and inadequate technical guidance for farmers (RPN = 168), all contributing to reduced accessibility and adoption of biofertilizers.
In contrast, Pathway 2 demonstrated greater efficiency and resilience due to its simplified structure, involving only the production unit and farmers. While it shared similar production-level risks, the absence of intermediaries reduced potential delays and maintained better product quality. Direct engagement between RARS scientists and farmers improved technical guidance and adoption outcomes. The most pressing issue in this model remained the limited number of supply points (RPN
= 280), though this can be addressed through mobile distribution units and local depots. Overall, the findings suggest that Pathway 2 is a more robust model for biofertilizer distribution, offering improved reliability, better farmer support and higher potential for sustainable agricultural impact in Andhra Pradesh.
Ahu, G., Singh, P and Kumar, S. 2016. Evaluation and selection of supply chain risk management strategies using Analytic Network Process and FMEA. International Journal of Production Research. 54(10): 2941–2957.
Garai, T.K., Datta, J.K and Mondal, N.K. 2013. Evaluation of integrated nutrient management on bororice in alluvial soil and its impacts upon growth, yield attributes, yield and soil nutrient status. Archives of Agronomy and Soil Science. 60: 1–14.
Khurana, A and Kumar, V. 2022. State of biofertilizers and organic fertilizers in India. Centre for Science and Environment. New Delhi. 32-48.
Ministry of Agriculture & Farmers Welfare, Government of India, 2023.
Shanks, K., Hamad, A and Ameer, A. 2020. Failure Modes Effects and Criticality Analysis and Fault Tree Analysis Case Study of Waste Heat Recovery Plant in a Cement Factory, United Arab Emirates. Journal of Failure Analysis and Prevention. 20: 40–50.