
0 Views
Department of Agricultural Economics, S.V. Agricultural College, ANGRAU, Tirupati-517502
In the era of globalization and free trade liberalization, the concept of collectivization or group initiation through local level
organization is very essential. Farmer Producer Organizations, principally using the concept of collectivisation, offer small farm- ers to participate in the market more effectively and collectively, they are in a better position to reduce transaction costs of ac- cessing inputs and outputs, obtaining the necessary market information, securing access to new technologies and allowing them to compete with larger farmers and agribusinesses. Keeping this in view the present study was conducted in Srikakulam district of Andhra Pradesh. Datawas collected from the FPOs through field survey by the interview method with the help of a pre-tested and well structure schedule. The results revealed that the majority (78.94%) of registered FPOs were promoted by NABARD followed by SFAC and BFTW each with 10.52 per cent respectively. The average number of members in FPOs promoted by NABARD was 531, SFAC promoted FPOs was 1250 and BFTW promoted FPOs was 835. The study revealed that in NABARD promoted FPOs 68.73 per cent of members were tribal farmers, in SFAC promoted FPOs it was 99.44 per cent while in the case of BFTW promoted FPOs all the members were tribal farmers only.
KEYWORDS: Farmer Producer Organizations (FPO), Socio-Economic Characteristics, Srikakulam.
Farmer Producer Organizations are the institutions meant for the development of farmers and the rural poor through collective actions of the individual members for increasing their livelihood so that to reduce the poverty. As the co-operatives were failed in the country to develop the rural poor farmers, the alternative solution was Farmer Producers Organizations (FPO’s). The main idea of FPO’s was to develop the small and marginal farmers. As the marketable surplus of these farmers was very less and are mostly depending on money lenders for their finance and mostly they sell their produce at a lower price in the village itself. As the FPOs had a better bargaining power as the bulk suppliers of the produce and bulk buyers of the inputs, helps the farmers to obtain a better price for their produce and purchasing of inputs at a lower price. In this background the present study was carried out to know the profile of FPOs in Srikakulam district of Andhra Pradesh.
In Srikakulam district 29 Farmer Producer Organizations were operating under 8 NGO’s and were promoted by National Bank for Agriculture and Rural Development (NABARD), Small Farmers Agribusiness Consortium (SFAC) and Bread for the World (BFTW). Out of 29 registered and functional FPOs in the district, 19 FPOs with two completed years of existence were chosen purposively for the study.The selected FPOs were 15 from NABARD, 2 from SFAC and2 from BFTW.
Data collected was interpreted in terms of their frequencies and percentages wherever necessary to know the socio-economic profile of FPOs. The methodology was taken from the reference of Darshan et al. (2017) from farmer producing organization for development of farmers in India.
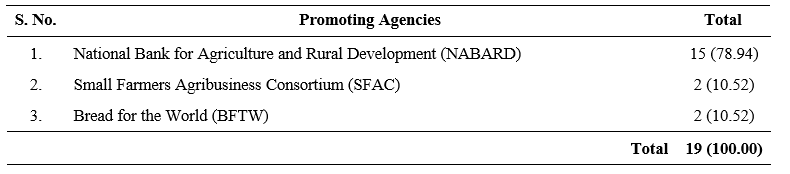
In the sample studied, highest number of FPOs were promoted by NABARD (78.94%) followed by SFAC (10.52%) and BFTW (10.52%) respectively. A proper roadmap with guidelines for promotion, selection methodology, budget, registration procedures etc were provided to Promotional Institutions (PI) by central government. Distribution of FPOs according to promoting agency wise was presented in Table 1.
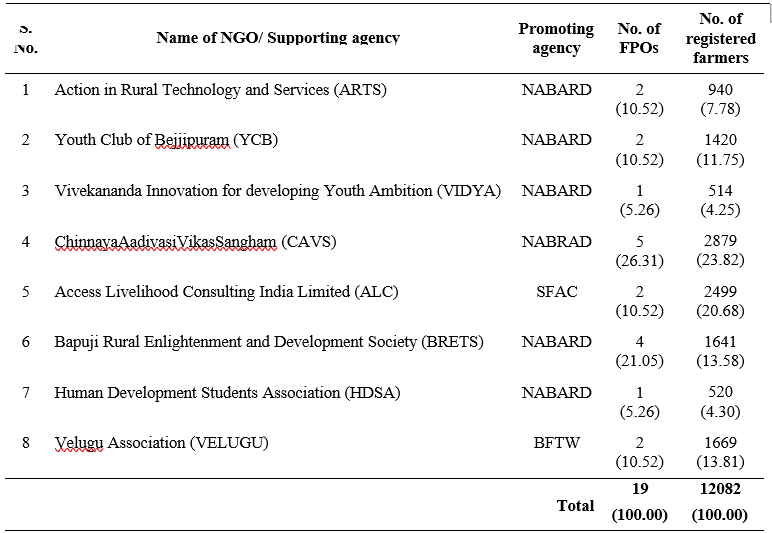
To promote FPOs the state government also developed its own separate and independent guidelines. All the FPOs in the study area were supported by 8 different Non-Governmental Organizations (NGOs) as shown in Table 2. The highest number of FPOs were supported by Chinnaya Aadivasi Vikas Sangham
(CAVS) with 26.31 per cent, followed by Bapuji Rural Enlightenment and Development Society (BRETS) with 21.05 per cent each. Action in Rural Technology and Services (ARTS), Youth Club of Bejjipuram (YCB), Access Livelihood Consulting India Limited (ALC) and Velugu Association (VELUGU) each with 10.52 per cent respectively. Rest 5.26 per cent each were supported by
Vivekananda Innovation for developing Youth Ambition (VIDYA) and Human Development Students Association (HDSA).
A total of 12082 small and marginal farmers were registered as members in FPOs promoted by NABARD, SFAC and BFTW. The highest number of registered farmers are in CAVS (23.82%), followed by ALC (20.68%), VELUGU (13.81%), BRETS (13.58%), YCB
(11.75%), ARTS (7.78%), HDSA (4.3%) and VIDYA (4.25%) respectively as shown in Table 2.
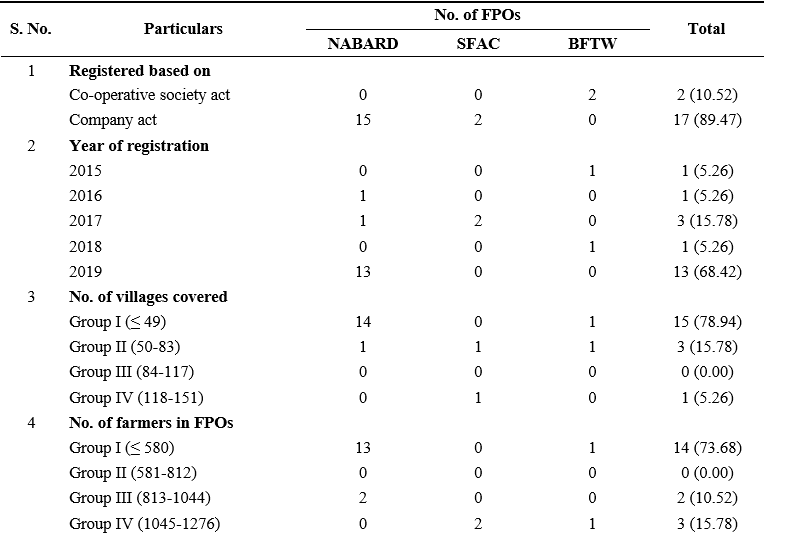
The results presented in Table 3 revealed that all the FPOs promoted by NABARD were registered under company act, the SFAC promoted FPOs were also registered under company act, only BFTW promoted FPOs were registered under co-operative society act. In total 89.47 per cent of FPOs were registered under company act and only 10.52 per cent were registered under co-operative society act. Out of 15 FPOs promoted by NABARD, 13 FPOs were formed in the year 2019 and one each was established in 2016 and 2017 respectively. All the FPOs promoted by SFAC were registered in the year 2017 and in BFTW promoted FPOs one was established in the year 2015 and one in 2018. In total 68.42 per cent of FPOs were established in the year 2019
followed by 15.78 per cent in 2017, 5.26 per cent each in 2015, 2016 and 2018 respectively. No. of villages covered by each FPO were classified into four groups i.e., group I (≤ 49 villages), group II (50-83 villages), group III (84-117 villages) and group IV (118-151 villages). Majority of the FPOs promoted by NABARD were fall in the group I followed by group II. In SFAC promoted FPOs one fall in group II and another in group IV. In BFTW promoted FPOs one FPO was fall in group I and other fall in group II. In total 78.94 per cent of FPOs were fall in group I followed by group II (15.78%) and group IV (5.26%). No. of farmers served by each FPO were also classified into four groups i.e., group I (≤ 580 members), group II (581-812 members), group III (813- 1044 members) and group IV (1045-1276 members). Majority of the FPOs promoted by NABARD were fall in group I followed by group III. All FPOs promoted by SFAC were fall in group IV and in BFTW promoted FPOs each one fall in group I and group IV respectively. In total majority of the FPOs (73.68%) were fall in group I followed by group IV (15.78%) and group III (10.52%).
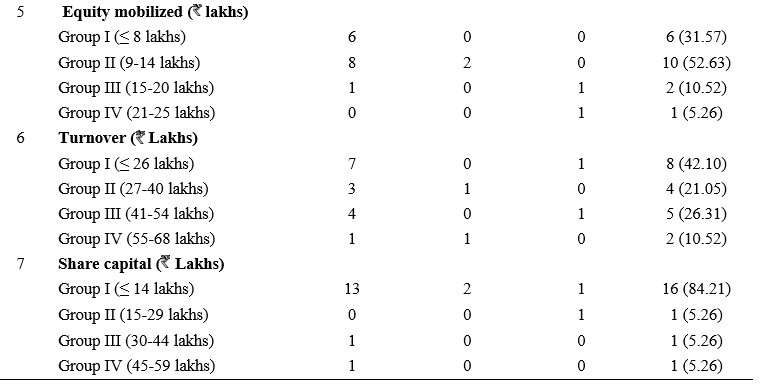
The equity mobilized of each FPO was categorized into four groups i.e., group I (≤ 8 lakhs), group II (9- 14 lakhs), group III (15-20 lakhs) and group IV (21-25 lakhs). Eight FPOs promoted by NABARD fall in group II followed by six in group I and one in group III. In SFAC promoted FPOs all were fall in group II and in BFTW FPOs each one fall in group III and group IV respectively. Overall 52.63 per cent of FPOs were fall in group II followed by group I (31.57%), group III (10.52%) and group IV (5.26%). The turnover of the FPOs was classified into four groups, group I (≤ 26 lakhs), group II (27-40 lakhs), group III (41-54 lakhs) and group IV (55-68 lakhs). More number of FPOs promoted by NABARD were fall in group I (7) followed by group III (4), group II (3) and group IV (1). In SFAC promoted FPOs each one fall in group II and group IV and in BFTW FPOs each one fall in group I and group III. In total majority of FPOs were fall in group I (42.10%) followed by group III (26.31%), group II (21.05%) and group IV (10.52%) respectively. The share capital also categorized into four groups viz., group I (≤ 14 lakhs), group II (15-29 lakhs), group III (30-44 lakhs) and group IV (45-59 lakhs). Majority of FPOs promoted by NABARD were fall in group I followed by each one in group III and IV respectively. In SFAC promoted FPOs all were fall in group I and in BFTW promoted FPOs
84.21 per cent of FPOs were fall in group I followed by each 5.26 per cent in group II, III and IV respectively.
From the results it was concluded that majority of FPOs were registered under company act and registered in the year 2019. Most of the FPOs were covering less than 49 villages and having less than 580 number of members. Most of the FPOs mobilized equity in the range of 9 to 14 lakhs, turnover was below 26 lakhs and the share capital was below 14 lakhs. The results were in line with the results of Nalini et al., 2017 in their study of farmers producer organizations as farmer collectives.
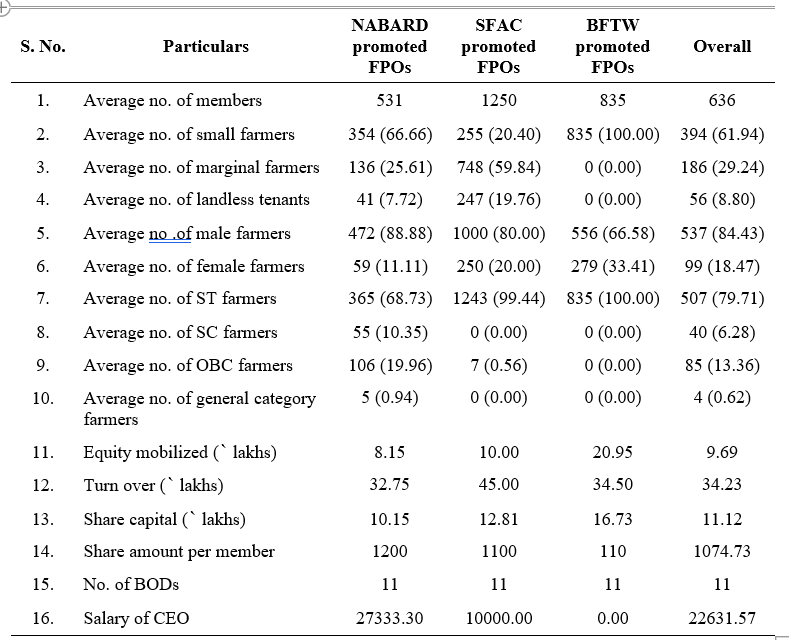
The average number of members in FPOs promoted by NABARD was 531, SFAC promoted FPOs was 1250 and BFTW promoted FPOs was 835. Overall the average number of members in FPOs was 636. In NABRAD promoted FPOs 66.66 per cent of members were small farmers followed by 25.61 per cent of marginal farmers and 7.72 per cent were landless tenants. In SFAC promoted FPOs 59.84 per cent were marginal farmers. All the members in BFTW promoted FPOs were small farmers. Overall each FPO served 61.94 per cent of small farmers followed by 29.24 per cent of marginal farmers and 8.80 per cent of landless tenants. Gender wise NABRAD promoted FPOs had 88.88 per cent of male farmers and 11.11 per cent of female members. In SFAC promoted FPOs 80 per cent were male members, 20 per cent were female members and in BFTW promoted FPOs 66.58 per cent were male members and 33.41 per cent were female members. Overall 84.43 per cent of FPO members were male farmers and the remaining 18.47 per cent were female farmers respectively. In NABARD promoted FPOs 68.73 per cent of members were fall in ST category followed by 19.96 per cent were fall in OBC category, 10.35 per cent in SC category and 0.94 per cent in General category. In the case of SFAC promoted FPOs 99.44 per cent were from ST category followed by 0.56 per cent from OBC. All the members in BFTW promoted FPOs were from ST category. On an average each FPO served 79.71 per cent of ST farmers followed by 13.36 per cent of OBC farmers, 6.28 per cent of SC farmers and 0.62 per cent of general farmers.
The average equity mobilized was observed more in BFTW promoting FPOs with ` 20.95 lakhs followed by ` 10 lakhs by SFAC promoting FPOs and ` 8.15 lakhs by NABARD promoting FPOs. Overall the equity mobilized by each FPO was ` 9.69 lakhs. The SFAC promoting FPOs had highest turnover with ` 45.00 lakhs followed by BFTW promoted FPOs with ` 34.50 lakhs and NABARD promoted FPOs with ` 32.75 lakhs. Overall the average amount of turnover by each FPO was ` 34.23 lakhs. The average share capital was found to be high in BFTW promoted FPOs with ` 16.73 lakhs followed by ` 12.81 lakhs by SFAC promoting FPOs and ` 10.15 lakhs by NABARD promoting FPOs. On an average each FPO had a share capital of ` 11.12 lakhs. The highest share amount per member was found in NABARD promoted FPOs with ` 1200 and the lowest share amount by BFTW promoting FPOs with ` 110 and it was ` 1100 in the case of SFAC promoted FPOs. Overall the average amount of share amount per member was ` 1074. The number of board of directors in all the FPOs promoted by three agencies was 11 only and the average salary of Chief executive officer was high in NABARD promoting FPOs with ` 27333.30 and SFAC promoting FPOs with ` 10000 respectively as shown in Table 4. The BFTW promoted FPOs were not appointing chief executive officer and FPOs were maintained by the decisions of the board of directors. The results were in line with the results of Prishila et al. (2019) in their study of performance of FPOs in Chhattisgarh plain in terms of ownership and management structure.
From the results it was concluded that majority (78.94%) of registered FPOs are supported by NABARD followed by SFAC and BFTW. Majority (89.47%) of FPOs are registered under Companies Act, rest 10.52 per cent of FPOs are registered under Co-operative Society Act. The highest number of FPOs are registered in CAVS with 26.31 per cent. From the percentage analysis of socio-economic profile that majority (54.16%) of respondents are females followed by 45.83 per cent of males. Most of the farmers who became the members of FPOs were middle aged with 41.66 per cent and they had great predominance of working efficiency. The majority (58.33%) of farmers were illiterates due to lack of formal institutions at village and mandal levels and the land holding is between 2-4 ha with 65.82 per cent of farmers. The highest 62.5 per cent of farmers has 3-5 years of experience in FPOs followed by 58.33 per cent were dependent upon agriculture with livestock farming, 45 per cent have annual income of 1-2 lakhs, 57.5 per cent have pucca houses, 85 per cent of farmers are having both marketing and subsistence as their farming purpose, 53.33 per cent have their own source of land, 39.16 percent have medium farming experience and 30.83 per cent of members are taking loan from both private and government sector.
Darshan, N.P., Rajashekar, B., Patil, K.V and Naik, J.P. 2017. Farmer Producing Organizations for development of farmers in India: An Economic perspective. International Journal of Current Microbiology and Applied Sciences. 6(9): 1611-1615.
Helen, L and Kevin, C. 2014. Producer Companies in India: Potential to support Increased Productivity and Profitability of Poor Smallholder Farmers. Smart Lessons. 1-5.
Hellin, J., Mark, L and Madelon, M. 2008. Farmer Organization, Collective action and market access in Meso-America. Food Policy. 34(1): 16-22.
Millns, J and Juhasz, J. 2006. Promoting farmer entrepreneurship through producer organizations in Central and Eastern Europe institutions for rural development, Food and Agriculture Organization of the United Nations, Rome, Working Paper 6.
Nalini, B., Mohana, R.R.T and Vaibhav, B. 2017. Farmer Producer Organizations as Farmer Collectives: A Case Study from India. Development Policy Review. 36(6): 669-687.
Prishila, K., Gauraha, A.K and Neha, L. 2019. Performance of Farmer Producer Organizations (FPOs) in Chhattisgarh plain in terms of Ownership and Management. Journal of Pharmacognosy and Phtochemistry. 8(6): 425-429.