
0 Views
Department of Crop Physiology, S.V. Agricultural College, ANGRAU, Tirupati-517 502.
A field experiment titled “Physiological Efficiency of Groundnut Varieties Under Rainfed Conditions” was conducted during kharif 2024, using a Randomized Block Design (RBD) with ten groundnut varieties and three replications. The present study assessed physiological efficiency and yield performance of ten groundnut genotypes under rainfed conditions. Parameters such as SPAD Chlorophyll Meter Reading (SCMR), Specific Leaf Area (SLA), Crop Growth Rate (CGR), Relative Growth Rate (RGR), and Net Assimilation Rate (NAR) were recorded at different growth stages. Significant variations among physiological and yield traits were observed across the varieties. Kadiri Lepakshi and Nithyaharitha recorded higher SCMR, indicating better early photosynthetic capacity. Kadiri-6 showed higher SLA and CGR, while Visishta recorded the highest early-stage RGR. Himani and Kadiri Lepakshi exhibited strong NAR during pod-filling. Kadiri Lepakshi also recorded the highest pod yield (3333.3 kg ha-1), highlighting its physiological efficiency and yield potential under rainfed conditions.
KEYWORDS: SPAD Chlorophyll Meter Readings (SCMR), Relative Growth Rate (RGR), Crop Growth Rate (CGR), Net Assimilation Rate (NAR)
Groundnut (Arachis hypogaea L.) is a globally significant oilseed crop, cultivated over an estimated 373 lakh hectares with a total production of 559 lakh tonnes and an average yield of 1,656 kg ha-1 (FAOSTAT, 2024). In India, the crop covers 48.80 lakh hectares, producing approximately 102.89 lakh tonnes with a productivity of 1,847.4 kg ha-1. In Andhra Pradesh, the crop is cultivated across 3.66 lakh hectares, yielding about 3.56 lakh tonnes with an average productivity of 1,141 kg ha-1 (ANGRAU 2024).
Globally, about 50% of groundnut production is used for oil extraction, 37% for direct consumption, and 12% for seed purposes. Groundnut kernels are a rich source of nutrition, containing high levels of fats (40– 50%), proteins (20–28%), and carbohydrates (10–20%), along with essential vitamins and minerals (Sharma et al., 2019). Crop Growth Rate (CGR) is directly associated with pod yield, indicating the genotype’s efficiency in converting intercepted light into biomass. Elevated CGR during the critical reproductive phases facilitates improved peg development and enhanced pod formation. Similarly, Relative Growth Rate (RGR) indicates initial seedling vigour and rate of early canopy establishment, significantly influencing peg penetration and survival.
Varieties exhibiting higher RGR demonstrate vigorous early growth, leading to enhanced peg strength and better pod retention under field conditions. Net Assimilation Rate (NAR), a key indicator of net photosynthetic efficiency, directly influences assimilate availability for reproductive structures such as pegs and pods. Increased NAR during the mid-pod filling stage has been shown to improve kernel growth and pod final weight (Kumari et al., 2022). Thus, integrating these growth indices offers a physiological basis for selecting high-yielding groundnut varieties adapted to specific agro ecological environments like rainfed systems of Andhra Pradesh.
The experiment entitled “Physiological Efficiency of Groundnut Varieties Under Rainfed Conditions” was conducted during kharif, 2024 of dryland farm, S.V. Agricultural College, Tirupati. Ten groundnut varieties were sown in a Randomized Block Design (RBD) with three replications.
Treatments: Groundnut varieties
T1 – Himani
T2 – Kadiri- 6
T3 – Konark
T4 – Pragati
T5 – Visishta
T6 – Kadiri Lepakshi
T7 – Dharani
T8 – Nithyaharitha
T9 – Dheeraj
T10 – Narayani
Observations were recorded for all 10 varieties separately from randomly chosen five competitive plants of each variety for all the three replications. The details of the data recorded were as follows.
SPAD (Soil Plant Analytical Development) Chlorophyll Meter Readings were recorded using Minolta chlorophyll meter (model SPAD 502). The SPAD readings were recorded for the leaf from top of each representative plant, between 10.00 AM to 12.00 Noon of the day by keeping on the different position of the leaf in the slot of the meter head and their average of readings was considered as the value of single plant. The readings of five tagged plants per each plot were averaged and considered as SPAD chlorophyll meter reading for each plot.
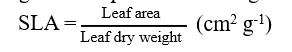
Specific leaf area is the mean area of leaf displayed per unit leaf weight. It is the ratio between leaf area to leaf dry weight and expressed in cm2 g-1.
Crop growth rate indicates the dry matter production by a plant community per unit area per unit time. It is used for the determination of production efficiency of a crop. It was estimated using the formula provided by Watson (1952) and expressed in gm-2 day-1.
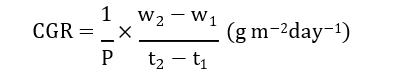
where,
W1 and W2 = dry weights at two sampling times t1 and t2, respectively.
t2 and t1 = sampling time in days
P = ground area occupied by plant (m2).
Relative Growth Rate (RGR) is the rate of dry matter increase per unit of existing dry matter per unit time. It was estimated using the formula provided by Blackman (1969).
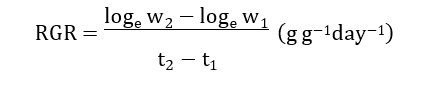
where,
W1 and W2 = dry weights at two sampling times t1 and t2, respectively.
Loge W2 = natural logarithm of dry weight at sampling time t2
Loge W1 = natural logarithm of dry weight at sampling time t1
t2 and t1 = sampling time in days
Net Assimilation Rate (NAR) is the rate of increase in leaf dry weight per unit area of leaf per unit time. NAR is calculated using the formula by Williams (1946) and results are expressed in mg cm-2 day-1.
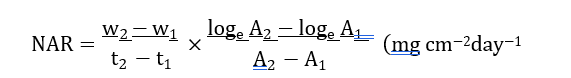
where,
Loge A2 – Natural log of leaf area at stage 2
Loge A1 – Natural log of leaf area at stage 1
A2 & A1 – Leaf area of whole plant at stage 2 & 1 respectively
W2 & W1 – Dry weight of the whole plant at stage 2 & 1 respectively
t2 – t1 – Time interval between the two stages.
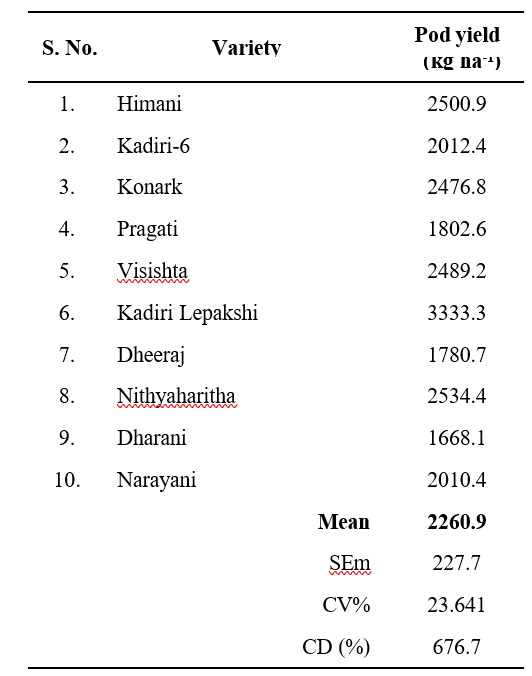
Pods harvested from net plot area were separated from haulms and sundried till constant weight attained and expressed as kg ha-1.
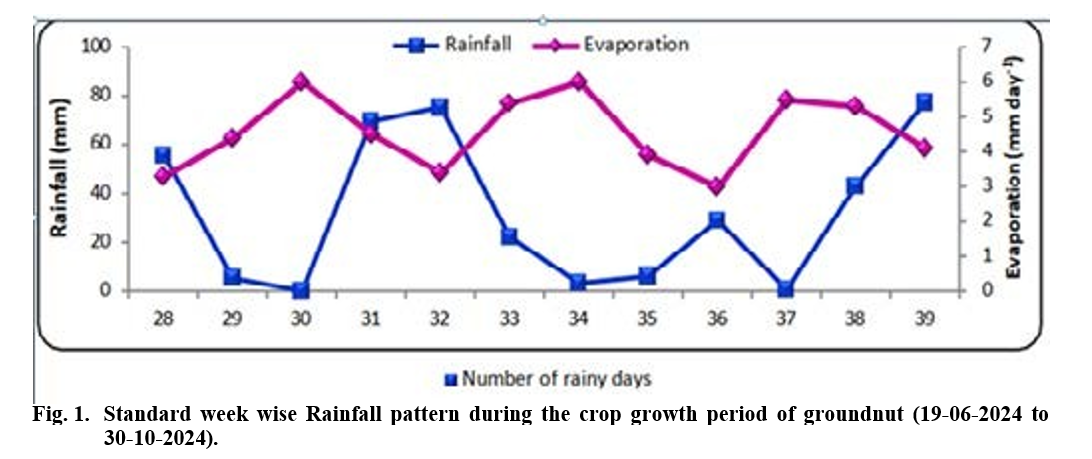
Rainfall pattern during the crop growth period (19-6- 2024 to 30-10-2024), was recorded at the Meteorological Observatory, S.V. Agricultural College, Tirupati (Fig 1).
During the crop growth period, a total amount of
386.6 mm of rainfall was received in 21 rainy days as against the decennial mean -4.61 mm received in 1.75 rainy days for the corresponding period.
Fig.1 Standard week wise Rainfall pattern during the crop growth period of groundnut (19-06-2024 to 30-10- 2024).
The results revealed, significant difference measured for all the measured traits and presented in Table.1 These growth parameters provide valuable insights into the efficiency of biomass accumulation and resource utilization during different stages of crop development.
SCMR is the indication of light-transmittance characteristics of leaf dependent on the leaf chlorophyll content. SCMR values were recorded at 40, 60, and 80 days after sowing (DAS) to assess chlorophyll content and photosynthetic efficiency in various groundnut genotypes. The results revealed significant differences among the varieties (Table 1).
At 40 DAS, Kadiri Lepakshi and Nithyaharitha recorded the highest SCMR (46.05), indicating better chlorophyll content and early growth, while Narayani (38.00) and Kadiri-6 (38.93) showed the lowest values (Kumar et al., 2019). At 60 DAS, Dharani (42.39) and Narayani (41.76) led, reflecting strong photosynthetic activity, whereas Pragati and Kadiri-6 had lower values (Badigannavar et al., 2002). At 80 DAS, Kadiri Lepakshi and Nithyaharitha again showed the highest SCMR (38.03), suggesting delayed senescence, while Kadiri-6 (30.46) and Himani (31.19) recorded the lowest, indicating early chlorophyll decline.
Specific Leaf Area (SLA), ratio of leaf area to its dry weight, is an indicator of leaf thickness, SLA was measured at 20, 40, 60, and 80 days after sowing (DAS), showing significant genotypic variation (Table 1).
At 40 DAS, Kadiri-6 (270.2 cm²g⁻¹), Narayani (268.2 cm²g⁻¹), and Visishta (254.8 cm²g⁻¹) recorded the highest SLA, suggesting larger leaf area and improved light capture, while Pragati showed the lowest (226.9 cm²g⁻¹), indicating thicker leaves. At 60 DAS, Narayani (240.6 cm²g⁻¹), Kadiri-6 (235.1 cm²g⁻¹), and Visishta (232.4 cm²g⁻¹) maintained high SLA, reflecting active leaf expansion, whereas Dharani (205.5 cm²g⁻¹) had the lowest. At 80 DAS, Dheeraj (194.8 cm²g⁻¹) recorded highest SLA, followed by Konark and Nithyaharitha, indicating ongoing photosynthesis. Pragati (166.8 cm²g⁻¹) and Himani (165.2 cm²g⁻¹) had the lowest SLA, suggesting early senescence. A higher SLA at later growth stages supports better pod filling (Badigannavar et al., 2002; Singh et al., 2014).
CGR denotes the rate of dry matter accumulation per unit land area, recorded in groundnut varieties at different crop growth stages 20-40 DAS, 40-60 DAS, 60-80 DAS during kharif (Table 1).
During the early vegetative stage, Kadiri-6 and Pragati recorded the highest CGR (10.0 g m⁻² day⁻¹), indicating strong early biomass buildup, followed by Dheeraj, Visishta, and Narayani. Konark had the lowest CGR (8.00 g m⁻² day⁻¹), suggesting slower canopy development. At the peak growth stage, Dheeraj (11.00 g m⁻² day⁻¹), Visishta (10.90 g m⁻² day⁻¹), and Narayani (10.80 g m⁻² day⁻¹) showed vigorous biomass accumulation, while Konark again had the lowest (10.00 g m⁻² day⁻¹). During the reproductive phase, Kadiri-6 led with the highest CGR (12.00 g m⁻² day⁻¹), supporting effective pod development. In contrast, Konark (7.50 g m⁻² day⁻¹) and Nithyaharitha (7.90 g m⁻² day⁻¹) had the lowest, indicating reduced growth due to early senescence (Badigannavar et al., 2002).
Relative Growth rate (RGR) measures the growth rate of a plant relative to its existing biomass. It also reflects the efficiency of assimilate (photosynthate) utilization and distribution during different growth stages. The RGR values of various groundnut varieties at different stages are presented in (Table 1).
At 20–40 DAS, Visishta (0.050 g g⁻¹ day⁻¹), Dheeraj (0.049 g g⁻¹ day⁻¹), and Himani (0.048 g g⁻¹ day⁻¹) showed the highest RGR, reflecting strong early growth, while Konark (0.042 g g⁻¹ day⁻¹) had the lowest. During 40–60 DAS, Dharani (0.040) and Nithyaharitha (0.039 g g⁻¹ day⁻¹) led, indicating efficient dry matter production.
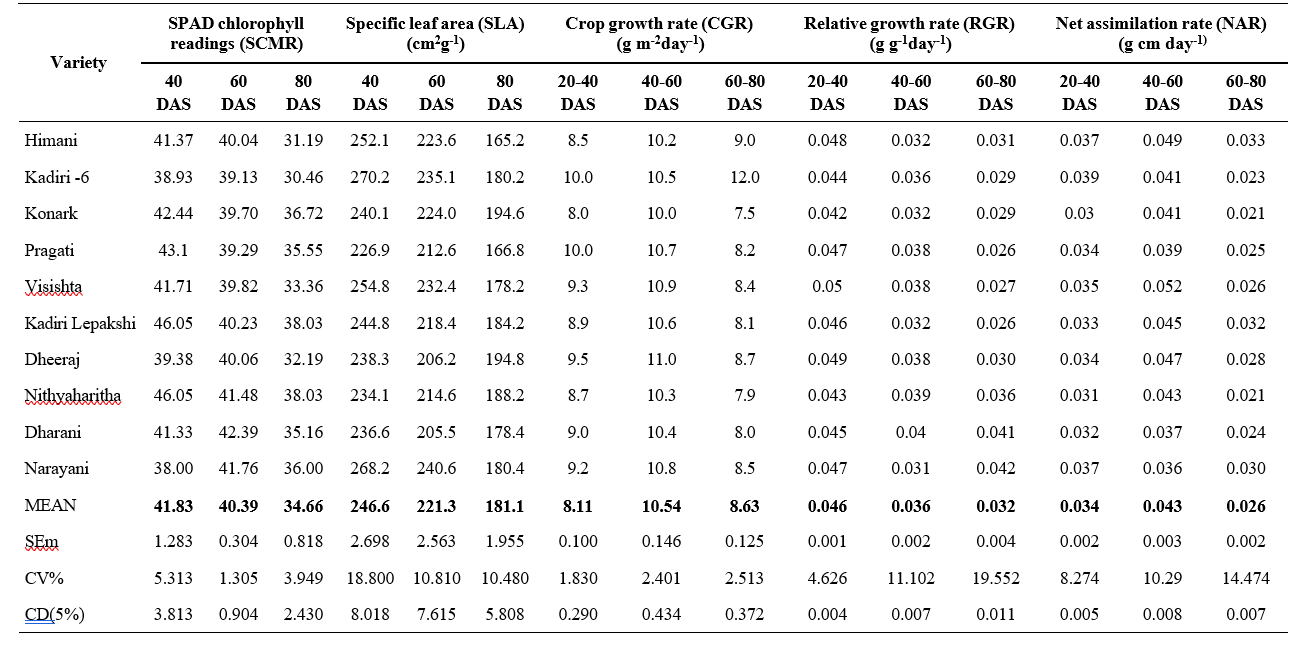
Narayani (0.031 g g⁻¹ day⁻¹) and Himani (0.032) showed reduced growth, likely due to assimilate diversion to reproductive parts. At 60–80 DAS, Narayani (0.042 g g⁻¹ day⁻¹) and Dharani (0.041 g g⁻¹ day⁻¹) maintained the highest RGR, whereas Pragati and Kadiri Lepakshi (both 0.026 g g⁻¹ day⁻¹)) had the lowest, possibly due to onset of senescence. Sustained RGR during pod-filling is essential for better yield (Badigannavar et al., 2002).
Net Assimilation Rate (NAR) indicates the efficiency with which a plant converts light into dry matter per unit leaf area. It is a key measure of photosynthetic efficiency. A decline in NAR often points a slower growth and less effective use of assimilates. NAR values recorded at different crop stages are shown in (Table 1).
At 20–40 DAS, Kadiri-6 (0.039 g cm⁻² day⁻¹), Himani, and Narayani (0.037 g cm⁻² day⁻¹) showed the highest NAR, indicating efficient early photosynthesis and canopy growth, while Konark had the lowest (0.030 g cm⁻² day⁻¹). During 40–60 DAS, Visishta (0.052 g cm⁻² day⁻¹), Himani (0.049 g cm⁻² day⁻¹), and Dheeraj (0.047 g cm⁻² day⁻¹) maintained high NAR, reflecting strong biomass conversion, whereas Dharani and Narayani had lower values. At 60–80 DAS, Himani (0.033 g cm⁻² day⁻¹) and Kadiri Lepakshi (0.032 g cm⁻² day⁻¹) led, showing sustained photosynthesis under stress. Konark and Nithyaharitha (0.021 g cm⁻² day⁻¹) recorded the lowest, possibly due to onset of senescence (Badigannavar et al., 2002).
Among the varieties Kadiri Lepakshi had recorded the highest pod yield (3333.3 kg ha-1), followed by
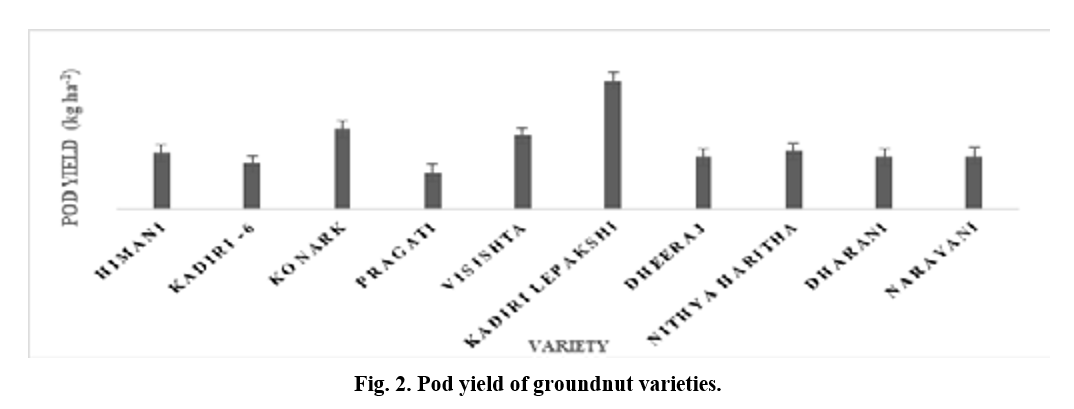
Nithyaharitha (2534.4 kg ha-1), Himani (2500.9 kg ha-1) and Visishta (2489.2 kg ha-1), These varieties were statistically on par, indicating efficient source-sink management. Pod yield data are presented in Figure2 and Table 2 .
The study highlights significant variation in physiological traits among ten groundnut genotypes cultivated under rainfed conditions. Traits such as SCMR, SLA, CGR, RGR, and NAR played key roles in influencing biomass accumulation, canopy development and pod formation. Varieties like Kadiri Lepakshi, Nithyaharitha, Himani, and Visishta consistently recorded superior performance across several growth indices. High SCMR and NAR values supported efficient photosynthesis, while optimal SLA and CGR contributed to better growth and yield. Varieties with higher RGR showed vigorous early establishment, aiding subsequent peg development. Stable physiological performance during critical growth stages enhanced pod filling and final yield. Kadiri Lepakshi stood out with the highest pod yield, making it a promising variety for rainfed cultivation. Overall, the integration of these growth parameters helps in identifying high-yielding and stress- resilient groundnut varieties.
Identifying QTLs/genes associated with high SCMR, optimal SLA, and efficient NAR, to integrate these traits through marker assisted selection or genomic selection approaches.
Combining the best performing genotypes with optimized agronomic practices (plant density, nutrient management, mulching, foliar sprays) to further enhance yield potential under rainfed cultivation.
Monitoring how these traits respond to progressive climate variability, to design breeding strategies for climate smart groundnut varieties.
Acharya N.G Ranga Agricultural university (ANGRAU). 2024 Crop Report of Andhra Pradesh: Groundnut (June 2023-May 2024) Centre for Agricultural and Rural Development Policy Research Guntur, India. Badigannavar, A.M., Kale, D.M and Murthy, G.S.S. 2002. Assessment of yielding ability of Trombay Groundnut (Arachis hypogaea L.) varieties through growth analysis. Journal of Oilseeds Research. 19: 207–212.
Blackman, V.H. 1969. The compound interest law and plant growth. Annals of Botany. 33: 352-360.
FAO.2024 FAOSTAT Statistical data base .Food and Agriculture Organization of the United Nation.
Kumar, N., Ajay, B.C., Rathanakumar, A.L., Radhakrishnan, T., Jadon, K.S and Chikani, B.M. 2019. Genetic variability analyses for yield and physiological traits in groundnut (Arachis hypogaea L.) genotypes. Journal of Oilseeds Research. 36: 1–7.
Sharma, S., Brar, K.S and Sandhu, S.K. 2019. Profiling of groundnut (Arachis hypogaea L.) genotypes for seed quality traits. Indian Journal of Plant Genetic Resources. 32(1): 72–79.
Singh, D., Balota, M., Isleib, T.G., Collakova, E and Welbaum, G.E. 2014. Suitability of canopy temperature depression, specific leaf area, and SPAD chlorophyll reading for genotypic comparison of peanut grown in a sub-humid environment. Peanut Science. 41(2): 100–110.
Watson, D.J. 1952. Physiological basis of variations in yield. Advances in Agronomy. 6: 103-109.
Williams, R. 1946. The physiology of plant growth with special reference to the concept of net assimilation rate. Annals of Botany. 10 (37):41-72.