
0 Views
Department of Genetics & Plant Breeding, S.V. Agricultural College, ANGRAU, Tirupati-517 502.
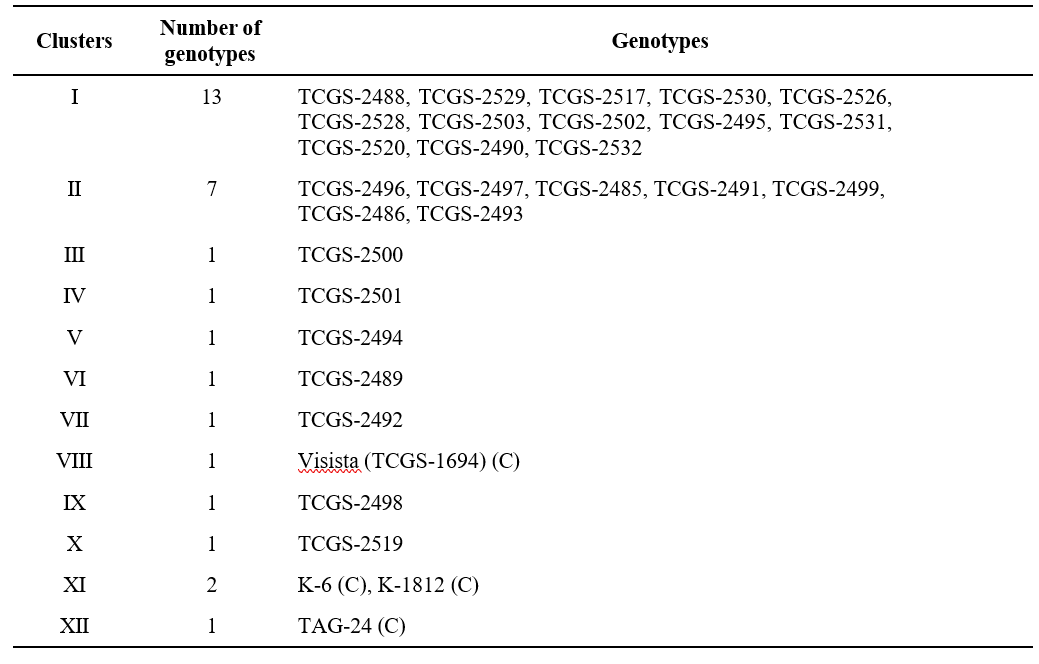
A set of thirty one groundnut genotypes were assessed for genetic divergence during kharif season of 2023 using Mahalanobis D2 statistics with regards to pod yield, yield components and resistance to late leaf spot. Among the characters studied, the plant height contributed maximum towards the total divergence. The groundnut genotypes were grouped into 12 clusters using Tocher’s method of clustering. Among these 12 clusters, cluster I had maximum number of 13 genotypes followed by cluster II with 7 genotypes, cluster XI with 2 genotypes and the remaining clusters were solitary having only one genotype. Cluster XI had the maximum intra cluster distance followed by cluster I. The maximum inter- cluster distance was observed between cluster XI and XII followed by cluster IX and cluster XI. In order to get better segregants for yield and yield components and resistance to late leaf spot, taking into consideration the cluster distances and cluster means in the current experiment, the crossing between the genotypes from clusters IX and XI is rewarding.
KEYWORDS: Cluster means, genetic divergence, groundnut, late leaf spot (LLS), Mahalanobis D2 statistics.
Groundnut is one of the most important oil seed crops of India which is native to Brazil. It is an annual legume, self-pollinated, allotetraploid (2n = 4x = 40) belongs to family Fabaceae (earlier Leguminosae). Groundnut is known as a “wonder legume” for its flowering, pegging and pod formation pattern (Boraiah et al., 2012). It contains oil (48-50%), protein (26-28%), carbohydrates (8-14%). It provides 564 kcal of energy from 100 g of kernels. Peanuts are a valuable source of essential minerals including calcium, phosphorus, and iron, as well as important vitamins like vitamin E, niacin, folic acid, riboflavin, and thiamine. Beyond their dietary and industrial uses, peanuts are gaining attention for their content of “resveratrol” a naturally occurring phenolic compound produced by plants under stress. Resveratrol has a variety of health benefits, including the effects against aging, cardiovascular diseases, cancers and atherosclerosis (Baur and Sinclair, 2006).
India ranks first in groundnut area under cultivation and is the second largest producer in the world and is grown in an area of 5.7 million ha with a production and productivity of 10.1 million tonnes and 1777 kg ha-1, respectively (FAOSTAT, 2024). Knowing the value of groundnut as a significant oilseed crop, in addition to ensuring food security, assessment of genetic divergence is essential for planning an effective breeding programme. The divergence analysis plays an effective role in choosing divergent parents for hybridization.
Keeping the above in view, the present investigation was undertaken to identify the best performing genotypes.
The experimental material for the present investigation comprised of 31 groundnut genotypes obtained from Regional Agricultural Research Station (RARS), Tirupati,
ANGRAU which is located at an altitude of 182.9 m above the mean sea level and are sown in dry-land farm during Kharif 2023 using a randomized block design (RBD) with three replications. Each entry was sown in 2 rows of 3 m row length at a spacing of 30 cm between rows and 10 cm within the row, in each replication.
For each genotype of groundnut, observations were recorded on five competitive plants at random except for days to 50% flowering and days to maturity, which were recorded on plot basis. Data was recorded for yield, yield components and resistance to late leaf spot viz., plant height at harvest, number of primary branches plant-1, number of secondary branches plant-1, number of mature pods plant-1, number of immature pods plant-1, pod yield plant-1, dry haulms yield plant-1, harvest index, shelling percent, kernel yield plant-1, sound mature kernel, hundred kernel weight, disease scoring of LLS at 75 DAS and 90 DAS. The data collected was subjected to Mahalanobis D2 statistics (Mahalanobis, 1936) and first suggested by Rao (1952) for the assessment of genetic divergence in plant breeding. Grouping of 31 genotypes of groundnut into different clusters were performed by Tocher’s method. The methods of Singh and Chaudhary (1977) were used for calculating the intra and inter cluster distances.
The thirty one genotypes studied in the present investigation were grouped into twelve clusters based on D2 values (Table 1). Cluster I is the largest with thirteen genotypes followed by Cluster II and Cluster XI with seven and two genotypes, respectively. Remaining clusters viz., Cluster III, IV, V, VI, VII, VIII, IX, X and XII consists of single genotype.
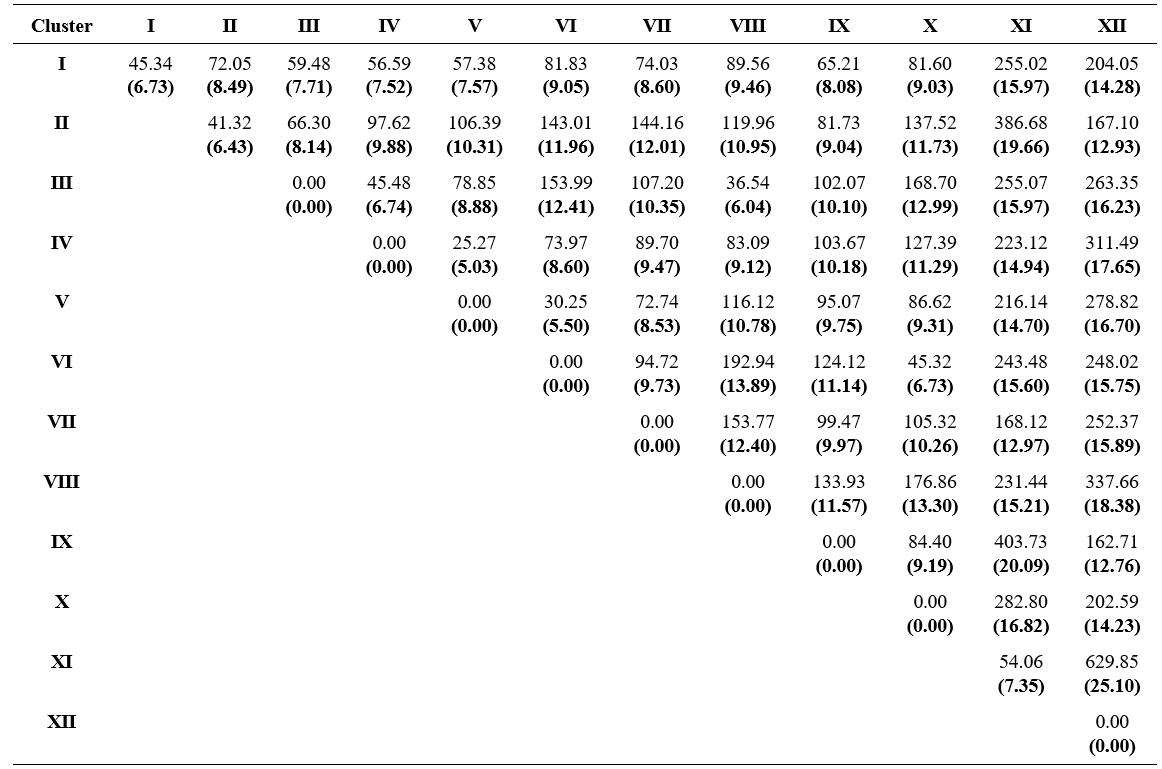
Inter- cluster distances (Table 2) were higher than intra- cluster distances indicating the availability of wider genetic divergence between the clusters rather than with in the clusters. Maximum intra- cluster distance was observed in cluster XI (54.06) followed by cluster I (45.34) and cluster II (41.32). This indicates the genotypes present in these clusters had wide variation among themselves. These results were confirmed with the findings of Suneetha et al. (2013), Shruti et al. (2019) and Dudhatra et al. (2022). Highest inter- cluster distance was observed between cluster XI and cluster XII (629.85)
followed by cluster IX and cluster XI (403.73), cluster II and cluster XI (386.68), cluster VIII and cluster XII (337.66) and cluster IV and cluster XII (311.49). Hence, the hybridization between genotypes of these clusters may create more variability in segregating population. Whereas, minimum inter- cluster distance was identified between cluster IV and V (25.27) followed by cluster V and VI (30.25), cluster III and cluster VIII (36.54). This states that clusters showing low inter- cluster distances are genetically nearer than clusters showing high inter- cluster distances.
Based on mean performance of different characters for various clusters (Table 3) revealed that genotypes present in the cluster VIII (25.33 days) was early for days to 50% flowering, high number of primary branches plant-1 (5.60), maximum mean value for number of mature pod plant-1 (19.43), low number of immature pod plant-1 (2.43), high dry haulms yield plant-1 (46.49 g), high harvest index (78.27%), maximum mean value for shelling percent (14.27%), maximum mean value for kernel yield plant-1 (92.00 g), lowest mean value for LLS score (75 DAS) (1.33) and low mean for LLS score (90 DAS) (18.23). Cluster XII was early maturing
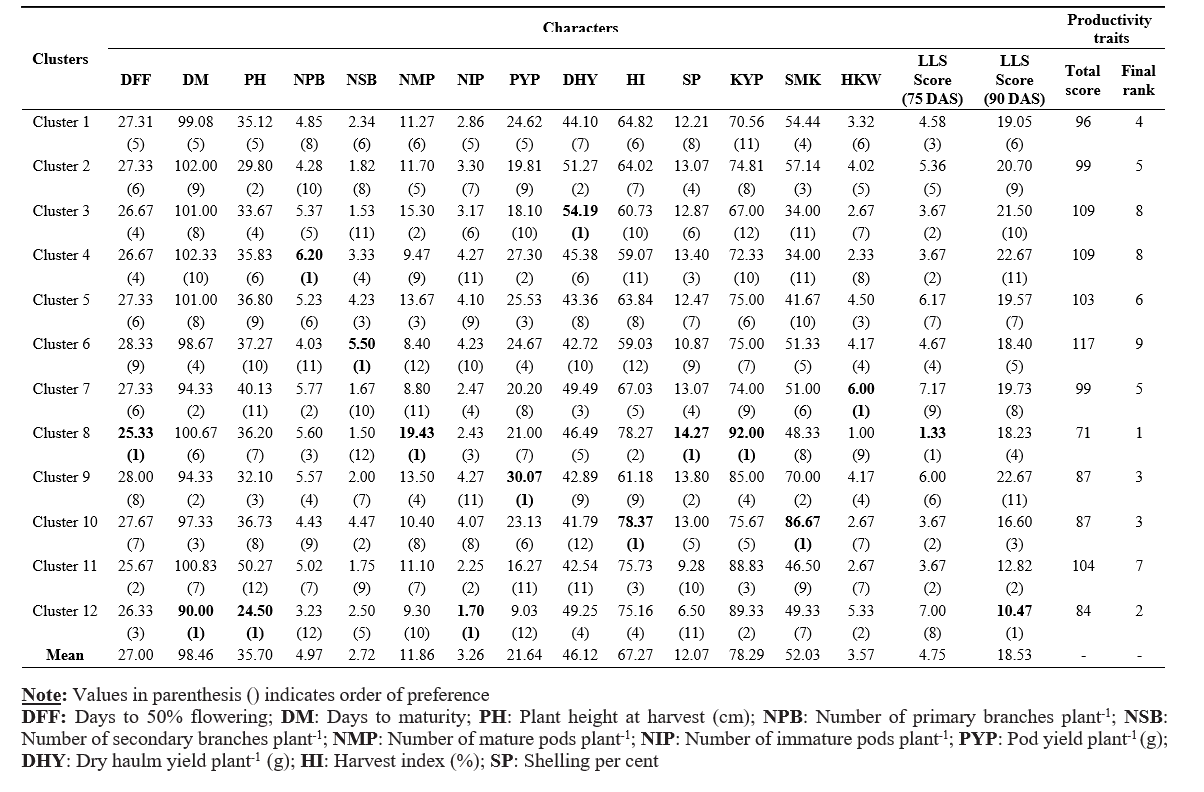
as it recorded lowest mean values for days to maturity (90.00 days) and possessed lowest mean value for plant height (24.50 cm), lowest mean value for number of immature pods plant-1 (1.70) along with lowest mean value for LLS score (90 DAS) (10.47). Genotypes in cluster IV showed maximum mean value for number of primary branches plant-1 (6.20), low values for days to 50% flowering (26.67 days), higher values for number of secondary branches plant-1 (3.33), higher values for pod yield plant-1 (27.30 g) higher values for shelling percent (13.4%). Cluster III recorded low values for days to maturity (101.00 days) and possessed maximum mean value for dry haulm yield plant-1 (54.19 g). The cluster VI showed maximum mean value for number of secondary branches plant-1 (5.50). The maximum mean value for hundred kernel weight (6.00 g) was recorded in cluster VII. The maximum mean value for pod yield plant-1 (30.07 g) was recorded in cluster IX. The cluster X showed maximum mean value for harvest index (78.37%) along with maximum mean value for sound mature kernel (86.67%). Therefore, crosses between members of clusters having high inter cluster distance along with high mean value for important characters are likely to be highly rewarding (Rajalakshmi et al., 2020).
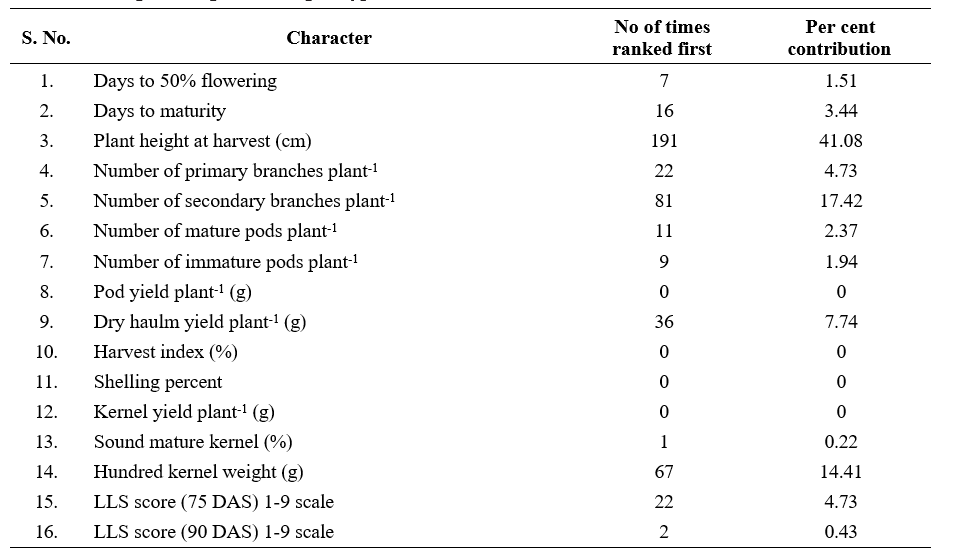
Information on the relative contribution of various plant characters towards divergence has also been reported to aid the breeder in choice of parents for hybridization and effective selections in the advance generations (Suneetha et al., 2013). In the present study, plant height contributed maximum towards total divergence (41.08%) followed by number of secondary branches plant-1 (17.42%), hundred kernel weight (14.41%), dry haulms yield plant-1 (7.74%), number of primary branches plant-1 (4.73%), LLS score (75 DAS) (4.73%), days to maturity (3.44%) and number of mature pod plant-1 (2.37%) (Table 4). The results obtained are in agreement with the findings of Mahalakshmi et al. (2005) for shelling percent, Raghuwanshi et al. (2016) for hundred pod weight, Vivekananda et al. (2015) and Yadav et al. (2022) for hundred kernel weight. Contribution of the remaining characters to total divergence was, however, relatively low. Therefore, the characters days to 50% flowering, days to maturity, plant height, number of primary branches plant-1, number of secondary branches plant-1, number of mature pods plant-1, number of immature pods plant-1, dry haulms yield plant-1, hundred kernel weight, disease scoring of LLS at 75 DAS contributing to 99.37 per cent of the total divergence need to be emphasised in selection of parents for hybridization.
From the present study it was concluded that, based on the divergence analysis the crosses viz., K-1812 x TAG-24, K-1812 x TCGS 2498, K-1812 x TCGS 2493, K-1812 x TCGS 2485, K-6 x TCGS 2486, Visista x TAG-24, TAG-24 x TCGS 2501 and K-1812 x TCGS 2519 were identified as the best cross combinations to get transgressive segregants for yield, yield components and resistance to late leaf spot in groundnut.
Baur J and Sinclair D.A. 2006. Therapeutic potential of resveratrol, the in vivo evidence. Nature reviews Drug Discovery. 5(6): 493–506.
Boraiah, K.M., Goud, S., Gejli, K., Konda, C.R., Babu and H.P. 2012. Heterosis for yield and yield attributing traits in groundnut (Arachis hypogaea L.). Legume Research. 35(2): 119-125.
Dudhatra, R.S., Viradiya, Y.A., Joshi, K.B., Desai, T.A and Vaghela, G.K. 2022. Genetic divergence analysis in groundnut (Arachis hypogaea L.) genotypes. Emer Life Science Research. 8(1): 114- 118.
FAOSTAT, 2024. Food and Agriculture Organization of the United Nations. World Agricultural Production, Rome, Italy. http: // faostat.fao.org/.
Mahalakshmi, P., Manivannan, N and Muralidharan, 2005. Variability and correlation studies in groundnut (Arachis hypogaea L.). Legume Research. 28(3): 194-197.
Mahalonobis, P.C. 1936. On the generalized distance in statistics. Proceedings of the National Institute of Science of India. 2(1): 49-55.
Raghuwanshi, S.S., Kachhadia, V.H., Vachhani, J.H., Jivani, L.L and Patel, M.B. 2016. Genetic divergence in groundnut (Arachis hypogaea L.). Electronic Journal of Plant Breeding. 7(1): 145-151.
Rajalakshmi, K., Manivannan, N., Anand, G., Vanniarajan, C and Harish, S. 2020. Genetic divergence among black gram [Vigna mungo (L.) Hepper] genotypes using Mahalanobis D2 statistics. Electronic Journal of Plant Breeding. 11(1): 116- 119.
Rao, C.R. 1952. Advanced Statistical Methods in Biometrical Research. John Wiley and sons. New York. 236-272.
Shruti, K, Rao, V.S., Rani, M.G., Sreekanth, B., Kumar, V.M and Umar, N. 2019. Genetic diversity studies in yield and its contributing traits in groundnut (Arachis hypogaea L.) genotypes using D2 statistics. International Journal Current Microbiology and Applied Sciences. 8(6): 32-38.
Singh, R.K and Chaudhary, B.D. 1977. Biometrical methods in quantitative genetic analysis. Kalyani Publishers, New Delhi. 215-218.
Suneetha, N., Vasanthi, R.P., Sudhakar, P and Reddy, K.R. 2013. Genetic diversity analysis among released and pre-release cultures in groundnut. Legume Research-An International Journal. 36(3): 208-213.
Vivekananda, Y., Khoyumthem, P and Singh, N.B. 2015. Genetic divergence analysis in groundnut (Arachis hypogaea L.). Electronic Journal of Plant Breeding. 6(1): 315-317.
Yadav, G.L., Rajput, S.S., Gupta, D., Kunwar, R., Yadav, O.P and Meena, A.K. 2022. Assessment of genetic diversity in groundnut (Arachis hypogaea L.) genotypes under semi-arid condition of Rajasthan. The Pharma Innovation Journal. 11(4): 538-541.