0 Views
Department of Agricultural Extension Education, S.V. Agricultural College, ANGRAU, Tirupati – 517 502
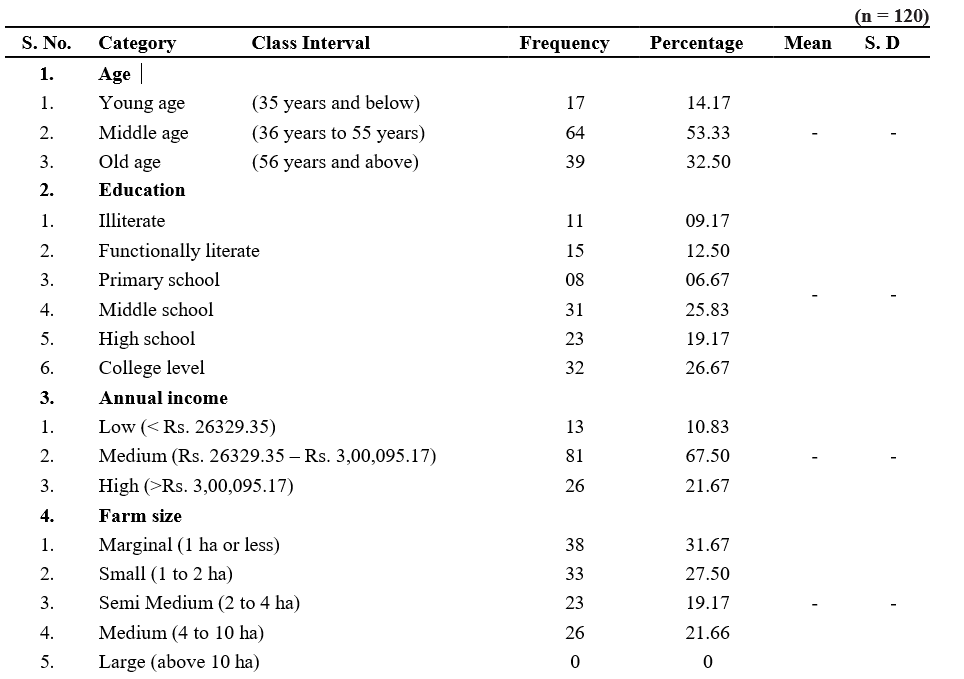
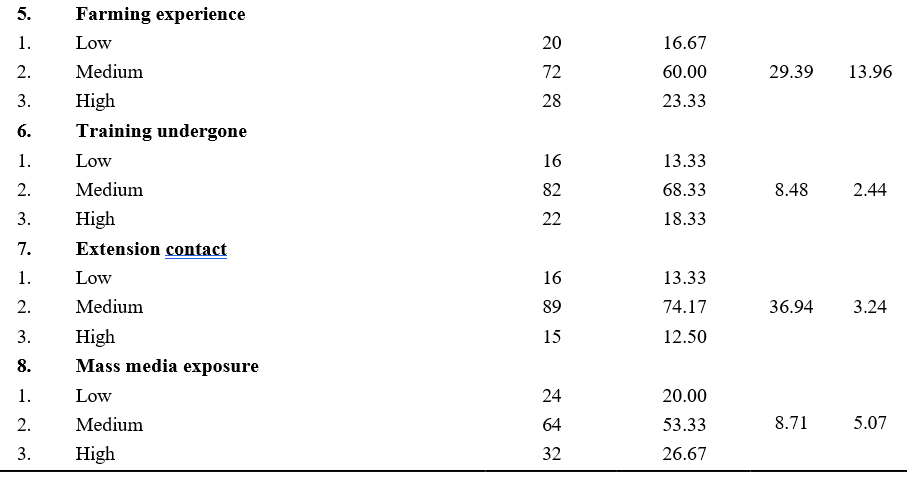
The present study was conducted in the district of Chittoor. To study the profile of RBK beneficiaries, a total of 120 respondents were randomly selected and interviewed. The respondents were in middle age group, educated up to college level (26.67%) and middle school (25.83%), had medium level of annual income (67.50%), had marginal farm size (31.67%), medium experience in farming (60.00%), training undergone (68.33%), extension contact (74.17%), mass media exposure (53.33%), innovativeness (70.00%), social participation (66.67%), scientific orientation (67.50%), economic orientation (68.33%) and achievement motivation (66.67%).
KEYWORDS: Rythu Bharosa Kendras (RBKs), Profile, Agri inputs.
As an agrarian state, Andhra Pradesh has a strong emphasis on the welfare of its farmers and the related agricultural and allied sectors. When it comes to increasing crop output and lowering cultivation costs, the availability of high-quality agricultural supplies and the appropriate recommendations are crucial. In the Agri Mission meeting in October 2019, it was suggested to establish an Agri Input Shop and a Village Knowledge Center at the village level close to the village secretariats through which only pre-tested quality inputs of seeds, fertilizers and pesticides with a quality seal from the government shall be supplied at the village level in addition to providing various government services, necessary trainings and capacity building of the farmers on the most recent agricultural technologies.
The Agri input shop and Knowledge center was combined and given the name of Dr. YSR Rythu Bharosa Kendram (Dr. YSR RBK) for improved synergy and convergence. In order to serve as a ONE STOP SHOP for the supply of pre-tested certified quality agri inputs (seeds, fertilizers and pesticides) and allied sector inputs (fodder, feed etc.) and dissemination of the most recent technology to the farming community, the government established 10,641 Rythu Bharosa Kendras (RBKs) on 30.05.2020 in all Village Secretariats with significant agriculture and allied activities. RBK current status in Andhra Pradesh 10,778. RBK current status in Chittoor district 946. Total number of mandals were 66, total number of villages were 1520 and eight RBKs covering in Chittoor district etc., Village Agriculture Assistant/ Horticulture Assistant/Sericulture Assistant and Village Animal Husbandry Assistant/Village Fisheries Assistant are in charge of running the RBKs in their respective jurisdictions, handling the responsibilities related to Agriculture, Horticulture and Sericulture respectively.
In the present study Exploratory and Ex-post- facto research designs were followed. The research was carried out in the Chittoor district of Andhra Pradesh was selected purposively as it highest number of RBKs. Four mandals of the district viz., Bangarupalem, Gangadhara Nellore, Kuppam and Srikalahasti were selected for the study based on the highest number of RBKs. From each of the selected four mandals, two villages were chosen at random and from each of the selected villages, 15 beneficiary farmers were selected on simple random sampling basis thus making a total of 120 respondents. The data were collected by personal interview method through a structured interview schedule and statistical techniques like arithmetic mean, standard deviation, frequencies and percentages were used.
The data gathered during the study were analyzed and the results are presented in Table 1.
Table 1 clearly indicated that more than half (53.33%) of the respondents were middle aged followed by old age (32.50%) and young age (14.17%) respectively. The probable reason for the above trend might be that, the old age and middle-age respondents who have been involved in farming since they were young have a passion for learning new technology and marketing strategies. On the other side, the young respondents may have chosen more profitable professions at the start of their careers. This result was in line with the conclusions of Gajanan (2019), Raju (2020) and Harisha (2021).
It is apparent from the Table 1 that 26.67 per cent of the respondents were educated up to college level followed by middle school (25.83%), high school (19.17%), functionally literate (12.50%), illiterate (9.17%) and primary school (6.67%) respectively. More than one-fourth respondents had college level and middle school followed by high school. There is no doubt that the provision of fundamental educational infrastructure in rural regions has improved and that respondents now have a clearer awareness of how important education is to their overall development. This trend was followed by functionally literate, illiterate and primary school. These result are consistent with those of Zunjar (2011) and Ganeshagouda et al. (2013).
Table 1 clearly depicted that more than two third (67.50%) of the respondents had medium level of annual income, followed by high (21.67%) and low (10.83%) levels of annual income categories. The probable reason for the above trend might be that majority of the respondents had marginal and small land holdings. The results were in accordance with Chhaganbhai (2016).
It could be seen from the Table 1 that 31.67 per cent of the respondents had marginal land holding followed by small (27.50%), medium (21.66%) and semi medium (19.17%) land holding categories. The results of the study showed that marginal and small land holdings dominated the study region. The most likely explanation is that joint families were broken up into nuclear families as a result of urbanization and the need for employment which in turn caused a temporary division of land ownership among the family members. As a result, there are now more small and marginal land holdings in society. The finding concurred with those of Pattnaik (2018) and Meethal (2019).
It is obvious from the Table 1 that, 60.00 per cent of the respondents had medium farming experience followed by high (23.33%) and low (16.67%) farming experience. The majority of respondents had medium levels of agricultural experience, followed by those with high and low levels of experience. The probable reason for the above trend might be that the majority of respondents were in the middle age group. The results of the above study were similar to Kadalgi (2017) and Kumari et al. (2019).
It is evident from the Table 1 that more than two- third (68.33%) of the respondents had medium level of training followed by high (18.33%) and low (13.33%) levels of training. Training is the process of altering a person’s attitudes, enhancing their knowledge and skill sets to enable them to do their tasks successfully. Most of the respondents received medium training. The fact that respondents participated in the majority of the training sessions hosted by the promotional and enabling organizations may be the cause of the above result. Few people fit into the high level of training category since they understood how crucial training was to achieve proficiency in any activity they undertook. A few energetic young respondents took part in the training sessions that were frequently held by the organizations that promoted and facilitated agriculture. Inadequate planning and organization of training programmes on the part of promoting and facilitating agencies, respondents being busy with their farm operations, lack of interest in sparing their time to participate in the training programmes and a lack of awareness among a small number of respondents regarding the value of training programmes were some of the probable reasons for the remaining respondents to be in the low category of training. Similar results were seen when comparing the findings of Naveenkumar and Rathakrishnan (2017) and Babu et al. (2021).
Table 1 clearly depicted that majority of the respondents had medium (74.17%) extension contact,