
0 Views
Department of Agricultural Economics, S.V. Agricultural College, ANGRAU, Tirupati-517 502.
The present study was conducted to know the behaviour of prices of onion in Solapur market of Maharashtra by using the multiplicative model of time series analysis. The time series data was collected for the period of 15 years from 2005 to 2019 from the NHRDF. The moving average method was used to know the price behaviour of onion. The results shown that there was an increasing trend in prices of onion in market and also observed the seasonal variation in prices of onion. The highest seasonal index was observed in the month of November and the lowest seasonal index was observed in the month of May. There were no existence of price cycles and also there was no periodicity in the irregular fluctuations for onion prices of Solapur market.
KEYWORDS: Multiplicative, Trend, Seasonal index, Periodicity, Fluctuations
India occupied first place in onion production in the world with 26.48 million tonnes followed by China, USA and others (FAOSTAT: 2020-21). Onions play an important role in India in earning foreign exchange due to increased exports in the recent decades, because of increased production and higher demand in international market (Gummagolmath et al., 2020).
Onion is an important ingredient of Indian culinary used as a vegetable and spice, and it has also immense medicinal and therapeutic value (Sendhil, 2012). As the demand for onions is inelastic (Ahmed and Singla, 2017), excessive supply due to favourable weather conditions and shortage in supply due to excessive rainfall or drought were the major reasons for the fluctuations in prices of onion. High demand rigidity, indispensable utilization in Indian diets and a near necessity (Saxena et al., 2020) makes the onion a market sensitive crop.
In India, major onion-producing states were Maharashtra, Karnataka, Madhya Pradesh, Gujarat, Bihar, Andhra Pradesh, Rajasthan, Haryana and Telangana. Among these states Maharashtra contributes 28.32 per cent of India’s onion production. Hence, the state of Maharashtra is called as ‘onion basket of India’ (Shah, 2020). Thus, in the light of the above background the present paper seeks to analyse the price behaviour of onion in Solapur market of Maharashtra.
Solapur market was purposively selected for the study as it is one of the largest onion markets in the state
of Maharashtra. To determine the objectives of the study time series data on monthly prices of onion was collected from the NHRDF for the Solapur market for the period of 15 years from 2005 to 2019. A multiplicative time series model was employed to study the components of time series viz., trend, seasonal, cyclical and irregular fluctuations.
Yt = Tt × St × Ct × It
where,
Yt = Time series data on prices
Tt = Trend component
St = Seasonal variations
Ct = Cyclical movements
It = Irregular fluctuations
Over a long period, time series is likely to show tendency to either increase or decrease over time. Ordinary least squares method was employed to ascertain the trend in prices. The equation adopted for this purpose is specified as
Yt = a + bXt+ Ut
where,
Yt = trend value at time t
Xt = Time
Ut = Random disturbance term
a = intercept and
b = Slope coefficient
The goodness of fit of trendline to the data was tested by the coefficient of multiple determination which is denoted by R2.
Twelve months moving average was employed to work out the seasonal indices in onion prices.
The steps involved in the construction of seasonal Index by this method are
This was done by calculating the correction factor and multiplying the average for the month by the correction factor, which was estimated as follows (Table 1)
K = 1200/S
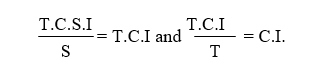
Percentage of centred 12 months moving average provided an index of seasonal and irregular components combined because,
(Pt / M.A) 100 = (Tt × Ct × St × It) 100/ (Tt × Ct) = (St × It)100
The irregular component was removed in the process of averaging each month’s ratio over the years and also through correction factor.
Cyclical variations are long term oscillatory movements with duration of greater than one year. The most commonly used method for estimating cyclical movement of time series is the residual method by eliminating the seasonal variation and trend. This is accomplished by dividing (Yt) by corresponding (S) for time ‘t’
Symbolically,
Taking the three-year moving average of the above series will yield the cyclical component.
It was estimated as residual component by using the estimates of model prices and cyclical components.
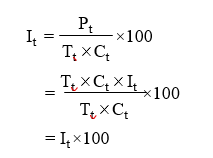
The trend component in prices gives the information of whether the prices were moving in increasing or decreasing direction or stagnant in nature over a long period of time. Generally, trends in agricultural prices are associated with general inflation and deflation in the economy and with factors specific to agricultural products, including changes in the tastes and preference of consumers, increase in population and income and technological changes in production (Tomek and Robinson, 1972). The results revealed that there was an increasing trend in prices of onion in Solapur market which presented in Fig. 1. The annual increment of price was found to be ` 5.58 per quintal. The results were significant at 1% level of significance. R-square results in the conclusion that the time contributed 19 per cent to the change in prices. The trend line constructed was 261.0 + 5.58*t. Similar findings also observed with the
Seasonal variations are the alterations that take place sporadically throughout the same time every year. Seasonal price changes mimic a cycle with at least a 12-month cycle. The general pattern of variation in prices is lower prices during the post harvesting months and higher prices during the pre-harvest or off-season months is a normal feature for many agricultural commodities and it is repeated year after year. Some of the factors that affect the extent of seasonality in prices include rise or

Table 2. Seasonal indices of onion prices in solapur market

fall in production, unseasonality or heavy rainfall, poor storage, early harvesting, lack of retention power by growers and exports etc. (Gummagolmath et al., 2020).
In order to analyse the seasonal variation in onion prices in the Solapur market, seasonal indices were computed by adopting 12 months moving average
method. The seasonal indices represented in Table 2 and Fig. 2. From the results, it was cleared that the highest seasonal index of prices was observed in the month of November followed by October and September with values of 130.00, 124.44 and 124.12 respectively. May had the lowest price seasonal index with value of 57.66. From the results it was observed that there was rising trend in prices of onion from June to November and decline in the prices from December to May. In Maharashtra onion was majorly cultivated in rabi season, and the rabi onions which has longer shelf life hits the market during the months of January to May. Hence there was a declining tendency in prices during this period. By the month of June and July the stocks of rabi onion diminishes and the kharif onion reaches the market. Hence the kharif onion attracts the traders and fetches a good price to the farmers. Hence there was an increasing trend in prices during the period from June to November.
The residual method was commonly used to know the cyclical movements in the prices of onion in Solapur market. The results of cyclical variations in prices of onion in market are presented in Fig. 3. From the results it was concluded that there were no price cycles identified in the prices of onion in Solapur market.
Irregular price movements represent that part of the price behavior, which is not systematic. No generalizations can be made about such fluctuations. The results of irregular price fluctuations were shown in Fig. 4. From the results, it was cleared that there
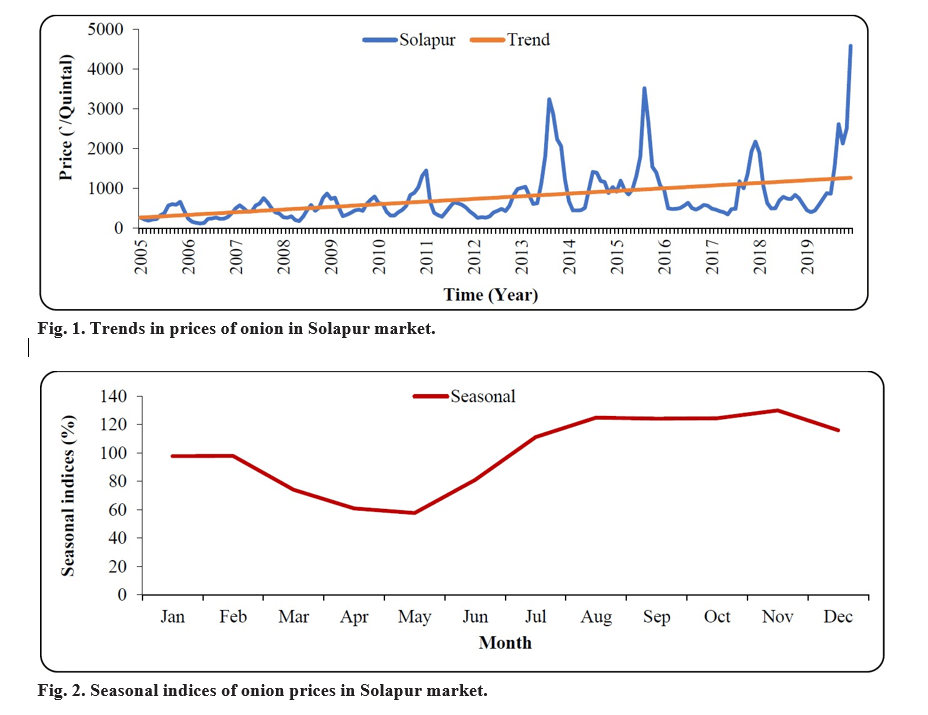

was no periodicity in the irregular fluctuations in their occurrence in Solapur market.
The present study proved the existence of four components of time series in the prices of onion in Solapur market. Increasing trend in the prices of onion was observed in the present study. Seasonal variation in prices plays a very important role in onion. Highest seasonal index was found in the month of November and the lowest seasonal index was found in the month of May. Price cycles were not observed in prices of onion during the period of study.
Ahmed, M and Singla, N. 2017. Market integration and price transmission in major onion markets of India. Economic affairs. 62(3): 405-417.
Areef, M., Rajeswari, S., Vani, N and Naidu, G.M. 2020. Price Behaviour and Forecasting of Onion Prices in Kurnool Market, Andhra Pradesh State. Economic Affairs. 65(1): 43-50
Gummagolmath, K.C., Lakshmi, S.B.R., Patra and Ronitha, A.P. 2020. Price instability of onion in India – An analysis. International Research Journal of Agricultural Economics and Statistics. 11(1):1-11.
Saxena, R., Paul, R.K and Kumar, K. 2020. Transmission of price shocks and volatility spillovers across major onion markets in India. Agricultural Economics Research Review. 33(1): 45-52.
Selvi, C.T., Naidu, G.M., Murthy B.R and Rajeshwari S. 2020. Trend and seasonal variation in arrivals and prices of onion in major markets of Tamil Nadu. Andhra Pradesh Journal of Agricultural Sciences. 6(2): 92-100.
Sendhil, R. 2012. Production and export performance of onions –An exploratory study. Agricultural Situation in India. 69(7): 355-362.
Shah, D. 2020. Divergence of onion prices in Maharashtra: A temporal variation analysis at wholesale and retail level. Indian Journal of Agricultural Marketing. 34(1): 1-15.
Tomek, W.G and Robinson, K.L. 1972. Agricultural Product Prices, Cornell University. Press, Ithaca and London.